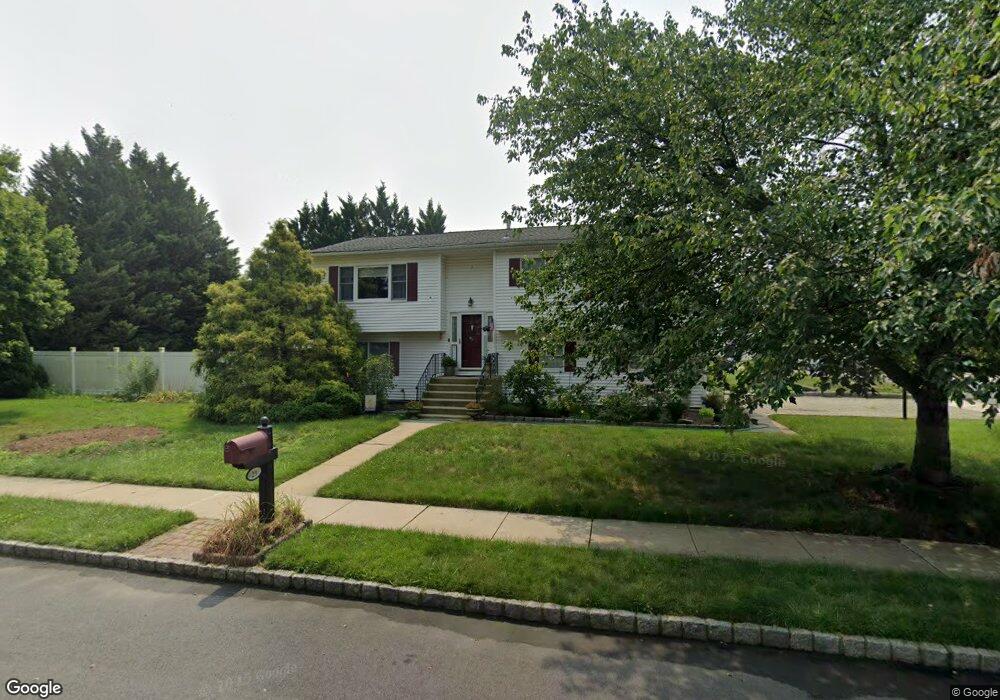
23 Pullman Loop Dayton, NJ 08810
Estimated Value: $619,000 - $728,000
4
Beds
2
Baths
1,822
Sq Ft
$368/Sq Ft
Est. Value
About This Home
This home is located at 23 Pullman Loop, Dayton, NJ 08810 and is currently estimated at $671,038, approximately $368 per square foot. 23 Pullman Loop is a home located in Middlesex County with nearby schools including Indian Fields Elementary School, Crossroads South Middle School, and South Brunswick High School.
Ownership History
Date
Name
Owned For
Owner Type
Purchase Details
Closed on
Aug 21, 2005
Sold by
Denny John
Bought by
Deleon Jose and Deleon Maria
Current Estimated Value
Home Financials for this Owner
Home Financials are based on the most recent Mortgage that was taken out on this home.
Original Mortgage
$385,900
Outstanding Balance
$206,094
Interest Rate
5.92%
Estimated Equity
$464,944
Purchase Details
Closed on
Jul 28, 2003
Sold by
White Dorise
Bought by
Denny John T
Home Financials for this Owner
Home Financials are based on the most recent Mortgage that was taken out on this home.
Original Mortgage
$315,000
Interest Rate
5.98%
Create a Home Valuation Report for This Property
The Home Valuation Report is an in-depth analysis detailing your home's value as well as a comparison with similar homes in the area
Home Values in the Area
Average Home Value in this Area
Purchase History
| Date | Buyer | Sale Price | Title Company |
|---|---|---|---|
| Deleon Jose | $454,000 | -- | |
| Denny John T | $350,000 | -- |
Source: Public Records
Mortgage History
| Date | Status | Borrower | Loan Amount |
|---|---|---|---|
| Open | Deleon Jose | $385,900 | |
| Previous Owner | Denny John T | $315,000 |
Source: Public Records
Tax History
| Year | Tax Paid | Tax Assessment Tax Assessment Total Assessment is a certain percentage of the fair market value that is determined by local assessors to be the total taxable value of land and additions on the property. | Land | Improvement |
|---|---|---|---|---|
| 2025 | $9,724 | $180,000 | $59,000 | $121,000 |
| 2024 | $9,374 | $180,000 | $59,000 | $121,000 |
| 2023 | $9,374 | $180,000 | $59,000 | $121,000 |
| 2022 | $9,095 | $180,000 | $59,000 | $121,000 |
| 2021 | $7,000 | $180,000 | $59,000 | $121,000 |
| 2020 | $9,151 | $180,000 | $59,000 | $121,000 |
| 2019 | $9,234 | $180,000 | $59,000 | $121,000 |
| 2018 | $8,932 | $180,000 | $59,000 | $121,000 |
| 2017 | $8,919 | $180,000 | $59,000 | $121,000 |
| 2016 | $8,825 | $180,000 | $59,000 | $121,000 |
| 2015 | $8,555 | $180,000 | $59,000 | $121,000 |
| 2014 | $8,417 | $180,000 | $59,000 | $121,000 |
Source: Public Records
Map
Nearby Homes
- 24 Pullman Loop
- 29 Liberty Dr
- 36 Haypress Rd
- 430 Ridge Rd
- 4 Lincoln Ln
- 4 Quincy Cir
- 342 Ridge Rd
- 1209 Blossom Cir
- 23 Scotto Place Unit 23
- Q10 Quincy Cir Unit Q-10
- 10-Q Dayton Cir
- 101 Dahlia Cir
- 30 Davids Ct
- 430-B Ridge Rd
- 430-A Ridge Rd
- 8 Marc Dr
- 62 Woodland Way
- 25 Stanley Ave
- 34 Scenic Dr
- 48 Woodland Way
Your Personal Tour Guide
Ask me questions while you tour the home.