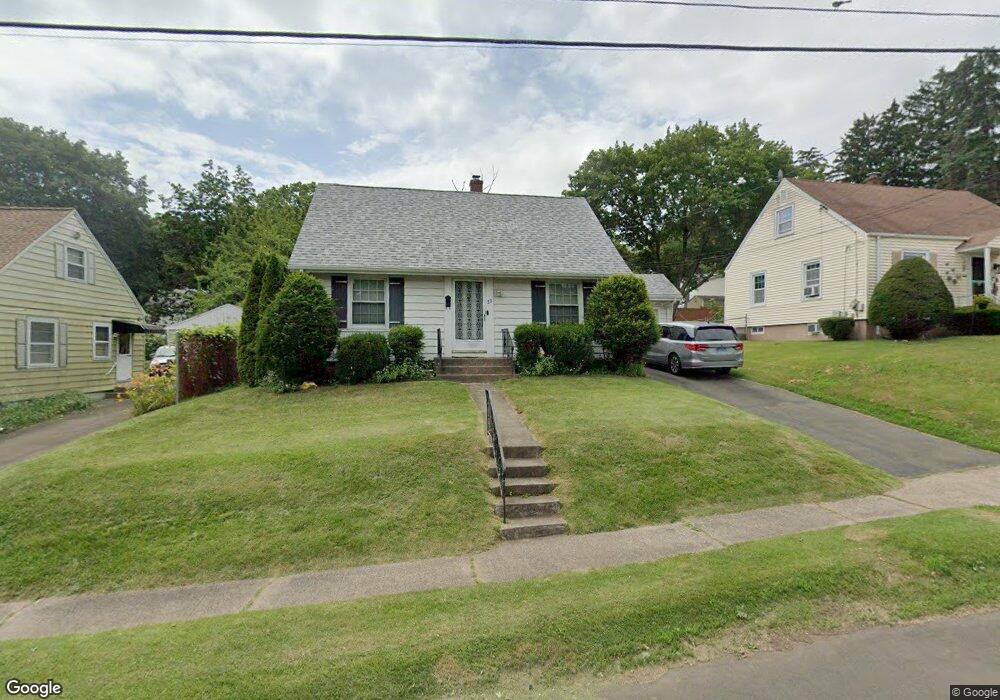
23 Quaker Rd Hamden, CT 06517
Estimated Value: $316,000 - $335,000
3
Beds
1
Bath
1,266
Sq Ft
$258/Sq Ft
Est. Value
About This Home
This home is located at 23 Quaker Rd, Hamden, CT 06517 and is currently estimated at $326,714, approximately $258 per square foot. 23 Quaker Rd is a home located in New Haven County with nearby schools including Ridge Hill School, Hamden Middle School, and Hamden High School.
Ownership History
Date
Name
Owned For
Owner Type
Purchase Details
Closed on
Sep 12, 2016
Sold by
Ung Nga T
Bought by
Ung Long B
Current Estimated Value
Purchase Details
Closed on
Apr 28, 1997
Sold by
Badamo Joseph P
Bought by
Ung Long B and Ung Nga T
Home Financials for this Owner
Home Financials are based on the most recent Mortgage that was taken out on this home.
Original Mortgage
$60,000
Interest Rate
7.77%
Mortgage Type
Unknown
Create a Home Valuation Report for This Property
The Home Valuation Report is an in-depth analysis detailing your home's value as well as a comparison with similar homes in the area
Home Values in the Area
Average Home Value in this Area
Purchase History
| Date | Buyer | Sale Price | Title Company |
|---|---|---|---|
| Ung Long B | -- | -- | |
| Ung Long B | $76,000 | -- |
Source: Public Records
Mortgage History
| Date | Status | Borrower | Loan Amount |
|---|---|---|---|
| Previous Owner | Ung Long B | $60,000 |
Source: Public Records
Tax History
| Year | Tax Paid | Tax Assessment Tax Assessment Total Assessment is a certain percentage of the fair market value that is determined by local assessors to be the total taxable value of land and additions on the property. | Land | Improvement |
|---|---|---|---|---|
| 2025 | $10,009 | $192,920 | $59,360 | $133,560 |
| 2024 | $7,038 | $126,560 | $34,790 | $91,770 |
| 2023 | $7,151 | $126,840 | $34,790 | $92,050 |
| 2022 | $7,037 | $126,840 | $34,790 | $92,050 |
| 2021 | $6,651 | $126,840 | $34,790 | $92,050 |
| 2020 | $5,105 | $98,210 | $45,360 | $52,850 |
| 2019 | $4,799 | $98,210 | $45,360 | $52,850 |
| 2018 | $4,710 | $98,210 | $45,360 | $52,850 |
| 2017 | $4,445 | $98,210 | $45,360 | $52,850 |
| 2016 | $4,455 | $98,210 | $45,360 | $52,850 |
| 2015 | $4,268 | $104,440 | $47,600 | $56,840 |
| 2014 | $4,159 | $104,160 | $47,600 | $56,560 |
Source: Public Records
Map
Nearby Homes
- 37 Quaker Rd
- 207 Franklin Rd Unit 207
- 272 Franklin Rd
- 135 London Dr
- 126 Hartford Turnpike
- 63 Park Rd
- 53 Park Rd
- 1165 Whitney Ave
- 1150 Whitney Ave Unit 5
- 110 Corbin Rd
- 195 Hepburn Rd
- 1204 Whitney Ave Unit 118
- 86 Foote St
- 200 Foote St
- 210 Foote St
- 42 Carroll Rd
- 133 Blake Rd
- 520 Hartford Turnpike
- 144 Edgehill Rd
- 78 Edgecomb St
Your Personal Tour Guide
Ask me questions while you tour the home.