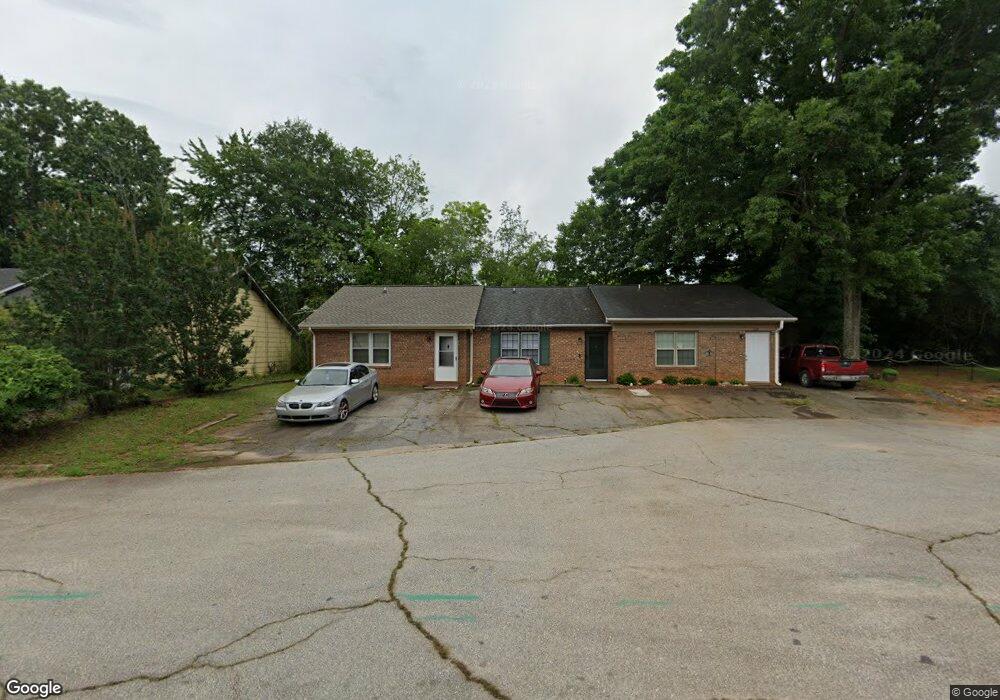
23 Rachel Ct Unit A Spartanburg, SC 29303
Estimated Value: $87,000 - $102,000
2
Beds
1
Bath
693
Sq Ft
$135/Sq Ft
Est. Value
About This Home
This home is located at 23 Rachel Ct Unit A, Spartanburg, SC 29303 and is currently estimated at $93,850, approximately $135 per square foot. 23 Rachel Ct Unit A is a home located in Spartanburg County with nearby schools including James H. Hendrix Elementary School, Boiling Springs Middle School, and Boiling Springs High School.
Ownership History
Date
Name
Owned For
Owner Type
Purchase Details
Closed on
Mar 3, 2023
Sold by
Ridings Alice
Bought by
Risfer Denise
Current Estimated Value
Purchase Details
Closed on
Jan 15, 2015
Sold by
Ridings Alice
Bought by
Kershaw Willie and Kershaw Shakeita
Home Financials for this Owner
Home Financials are based on the most recent Mortgage that was taken out on this home.
Original Mortgage
$60,000
Interest Rate
3.98%
Mortgage Type
Seller Take Back
Purchase Details
Closed on
Jan 15, 2013
Sold by
Estate Of Donny Buford Ridings
Bought by
Ridings Alice
Purchase Details
Closed on
Oct 7, 2004
Sold by
Upstate Investment Properties Llc
Bought by
Ridings Buford
Purchase Details
Closed on
Oct 5, 2004
Sold by
Branch Banking & Trust Co
Bought by
Upstate Investment Properties Llc
Purchase Details
Closed on
Sep 4, 2003
Sold by
Feemster Darryl A
Bought by
Branch Banking & Trust Co
Create a Home Valuation Report for This Property
The Home Valuation Report is an in-depth analysis detailing your home's value as well as a comparison with similar homes in the area
Home Values in the Area
Average Home Value in this Area
Purchase History
| Date | Buyer | Sale Price | Title Company |
|---|---|---|---|
| Risfer Denise | -- | -- | |
| Risfer Denise | -- | -- | |
| Kershaw Willie | $60,000 | -- | |
| Ridings Alice | -- | -- | |
| Ridings Buford | $31,500 | -- | |
| Upstate Investment Properties Llc | $24,000 | -- | |
| Branch Banking & Trust Co | $31,000 | -- |
Source: Public Records
Mortgage History
| Date | Status | Borrower | Loan Amount |
|---|---|---|---|
| Previous Owner | Kershaw Willie | $60,000 |
Source: Public Records
Tax History Compared to Growth
Tax History
| Year | Tax Paid | Tax Assessment Tax Assessment Total Assessment is a certain percentage of the fair market value that is determined by local assessors to be the total taxable value of land and additions on the property. | Land | Improvement |
|---|---|---|---|---|
| 2025 | $2,143 | $5,682 | $1,344 | $4,338 |
| 2024 | $2,143 | $5,682 | $1,344 | $4,338 |
| 2023 | $2,143 | $5,682 | $1,344 | $4,338 |
| 2022 | $1,661 | $4,194 | $900 | $3,294 |
| 2021 | $1,661 | $4,194 | $900 | $3,294 |
| 2020 | $1,645 | $4,194 | $900 | $3,294 |
| 2019 | $1,645 | $4,194 | $900 | $3,294 |
| 2018 | $1,604 | $4,194 | $900 | $3,294 |
| 2017 | $1,519 | $3,936 | $900 | $3,036 |
| 2016 | $1,519 | $3,936 | $900 | $3,036 |
| 2015 | $1,508 | $3,452 | $789 | $2,663 |
| 2014 | $1,502 | $3,936 | $900 | $3,036 |
Source: Public Records
Map
Nearby Homes
- 100 Clary Dr
- 9 Willow Pines Ct
- 157 Stoney Brook Dr
- 117 Hendrix Dr
- 2031 Evergreen Dr
- 921 E Emerald Springs Dr
- 156 Hunter Ridge Dr
- 943 Monks Grove Church Rd
- 522 Hemlock Dr
- 3036 Elmhurst Dr
- 3038 Elmhurst Dr
- 210 Oakmont Dr
- 2274 Hemming Way
- 108 Woodshire Dr
- 0 Woodshire Dr Unit 316794
- 207 Oakmont Dr
- 161 Stonewood Crossing Dr
- 662 Branch View Dr
- 238 River Forest Dr
- 424 All Seasons Dr
- 23 Rachel Ct
- 23 Rachel Ct Unit C
- 23 Rachel Ct Unit B
- 23 Rachel Ct Unit A
- 21 Rachel Ct
- 21 Rachel Ct
- 21 Rachel Ct Unit C
- 21 Rachel Ct Unit B
- 21 Rachel Ct Unit D
- 21 Rachel Ct Unit A
- 0 Stonecreek Dr Unit 241928
- 0 Stonecreek Dr Unit 1336619
- 25 Rachel Ct
- 25 Rachel Ct Unit D
- 25 Rachel Ct Unit C
- 25 Rachel Ct Unit A
- 25 Rachel Ct Unit B
- 22 Rachel Ct
- 22 Rachel Ct Unit A
- 22 Rachel Ct Unit B