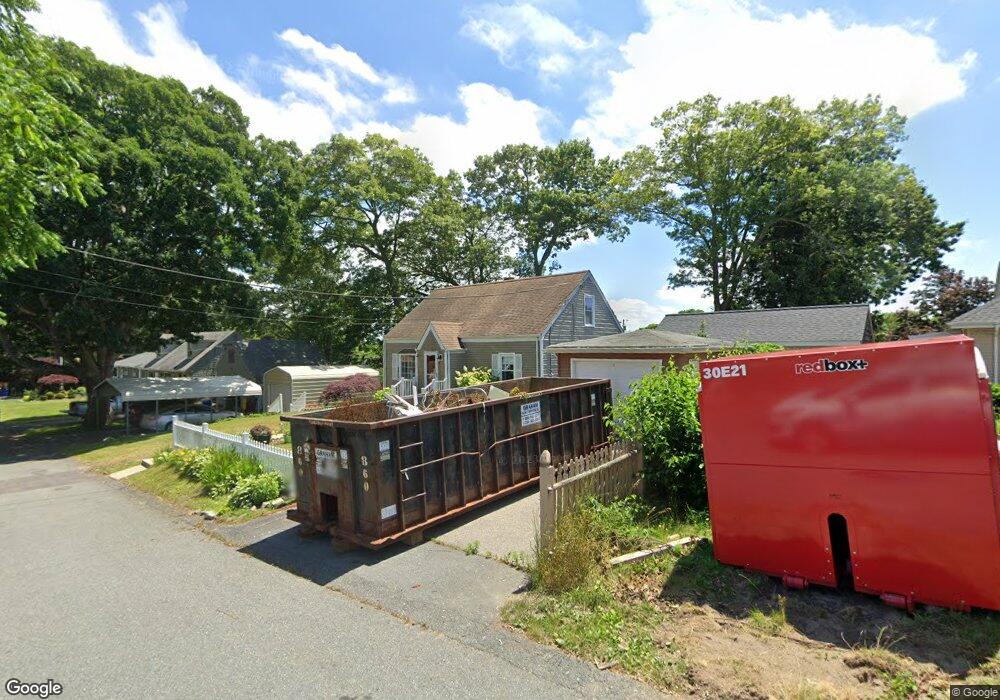
23 Rathgar St Fall River, MA 02720
Highlands-Fall River NeighborhoodEstimated Value: $401,841 - $462,000
3
Beds
1
Bath
1,126
Sq Ft
$377/Sq Ft
Est. Value
About This Home
This home is located at 23 Rathgar St, Fall River, MA 02720 and is currently estimated at $424,710, approximately $377 per square foot. 23 Rathgar St is a home located in Bristol County with nearby schools including Spencer Borden Elementary School, Morton Middle School, and B M C Durfee High School.
Ownership History
Date
Name
Owned For
Owner Type
Purchase Details
Closed on
Nov 10, 2009
Sold by
Denardo Frank and Denardo Elaine
Bought by
Denardo Tr Frank and Denardo Elaine
Current Estimated Value
Purchase Details
Closed on
Mar 12, 1991
Sold by
Joerres William O
Bought by
Denardo Frank
Home Financials for this Owner
Home Financials are based on the most recent Mortgage that was taken out on this home.
Original Mortgage
$100,800
Interest Rate
9.51%
Mortgage Type
Purchase Money Mortgage
Create a Home Valuation Report for This Property
The Home Valuation Report is an in-depth analysis detailing your home's value as well as a comparison with similar homes in the area
Home Values in the Area
Average Home Value in this Area
Purchase History
| Date | Buyer | Sale Price | Title Company |
|---|---|---|---|
| Denardo Tr Frank | -- | -- | |
| Denardo Frank | $112,000 | -- |
Source: Public Records
Mortgage History
| Date | Status | Borrower | Loan Amount |
|---|---|---|---|
| Previous Owner | Denardo Frank | $123,000 | |
| Previous Owner | Denardo Frank | $90,000 | |
| Previous Owner | Denardo Frank | $103,500 | |
| Previous Owner | Denardo Frank | $100,800 |
Source: Public Records
Tax History
| Year | Tax Paid | Tax Assessment Tax Assessment Total Assessment is a certain percentage of the fair market value that is determined by local assessors to be the total taxable value of land and additions on the property. | Land | Improvement |
|---|---|---|---|---|
| 2025 | $3,946 | $344,600 | $137,500 | $207,100 |
| 2024 | $3,726 | $324,300 | $132,200 | $192,100 |
| 2023 | $3,629 | $295,800 | $118,700 | $177,100 |
| 2022 | $3,241 | $256,800 | $109,900 | $146,900 |
| 2021 | $3,261 | $235,800 | $103,800 | $132,000 |
| 2020 | $3,071 | $212,500 | $99,900 | $112,600 |
| 2019 | $3,037 | $208,300 | $99,900 | $108,400 |
| 2018 | $2,933 | $200,600 | $99,900 | $100,700 |
| 2017 | $2,782 | $198,700 | $99,900 | $98,800 |
| 2016 | $2,635 | $193,300 | $99,900 | $93,400 |
| 2015 | $2,443 | $186,800 | $93,400 | $93,400 |
| 2014 | $2,350 | $186,800 | $93,400 | $93,400 |
Source: Public Records
Map
Nearby Homes
- 108 Garden St
- 742 New Boston Rd
- 295 Newbury St
- 677 Oak Grove Ave
- 25 O'Hearn St
- 301 Madison St
- 1231 Robeson St
- 309 Doherty St
- 65 Bigelow St
- 499 Hanover St
- 36 Fordney St
- 27 Kane St
- 45-47 Shawmut St
- 503 Highland Ave
- 545 Robeson St
- 208 Florence St
- 213 Weetamoe St
- 247 Albany St
- 333 Langley St
- 884 Cherry St
Your Personal Tour Guide
Ask me questions while you tour the home.