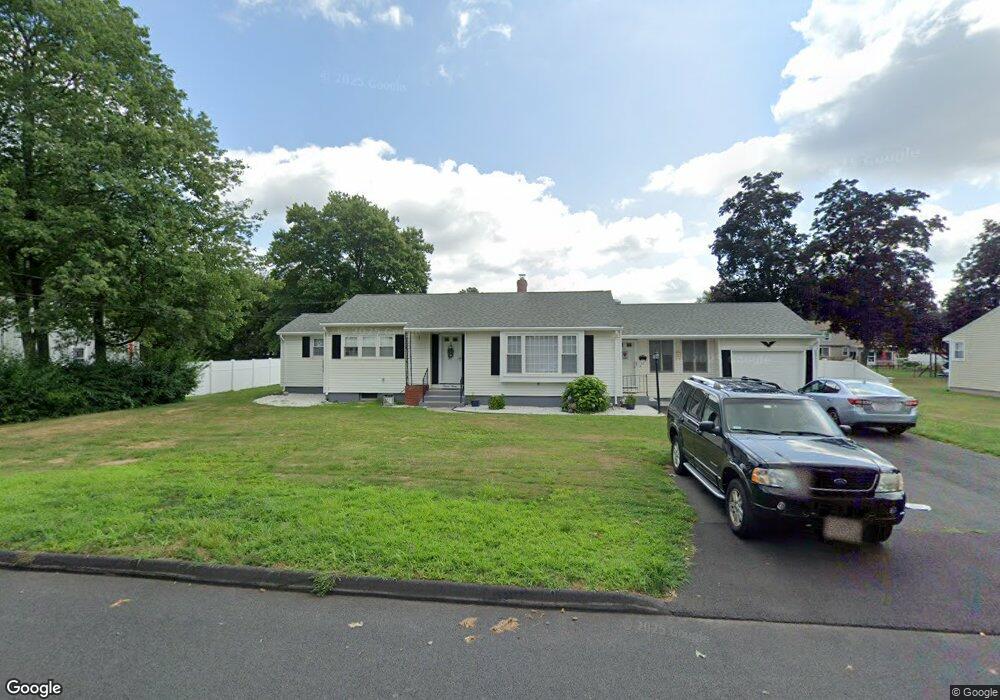
23 Raymond Place Cromwell, CT 06416
Estimated Value: $395,000 - $437,000
3
Beds
2
Baths
1,591
Sq Ft
$262/Sq Ft
Est. Value
About This Home
This home is located at 23 Raymond Place, Cromwell, CT 06416 and is currently estimated at $417,296, approximately $262 per square foot. 23 Raymond Place is a home located in Middlesex County with nearby schools including Edna C. Stevens School, Woodside Intermediate School, and Cromwell Middle School.
Ownership History
Date
Name
Owned For
Owner Type
Purchase Details
Closed on
Jun 14, 2019
Sold by
152016 Peterson Lt
Bought by
Maldonado Christopher and Maldonado Christina
Current Estimated Value
Home Financials for this Owner
Home Financials are based on the most recent Mortgage that was taken out on this home.
Original Mortgage
$170,000
Outstanding Balance
$149,472
Interest Rate
4.1%
Mortgage Type
Purchase Money Mortgage
Estimated Equity
$267,824
Purchase Details
Closed on
Apr 9, 2014
Sold by
Peterson Ervin W and Peterson Debra J
Bought by
Peterson Ervin W and Peterson Debra J
Purchase Details
Closed on
Sep 26, 2002
Sold by
Thompson Gary
Bought by
Peterson Ervin W and Peterson Debra J
Home Financials for this Owner
Home Financials are based on the most recent Mortgage that was taken out on this home.
Original Mortgage
$172,950
Interest Rate
6.25%
Create a Home Valuation Report for This Property
The Home Valuation Report is an in-depth analysis detailing your home's value as well as a comparison with similar homes in the area
Home Values in the Area
Average Home Value in this Area
Purchase History
| Date | Buyer | Sale Price | Title Company |
|---|---|---|---|
| Maldonado Christopher | $225,000 | -- | |
| Peterson Ervin W | -- | -- | |
| Peterson Ervin W | $188,000 | -- |
Source: Public Records
Mortgage History
| Date | Status | Borrower | Loan Amount |
|---|---|---|---|
| Open | Maldonado Christopher | $170,000 | |
| Previous Owner | Peterson Ervin W | $172,950 |
Source: Public Records
Tax History Compared to Growth
Tax History
| Year | Tax Paid | Tax Assessment Tax Assessment Total Assessment is a certain percentage of the fair market value that is determined by local assessors to be the total taxable value of land and additions on the property. | Land | Improvement |
|---|---|---|---|---|
| 2025 | $5,940 | $192,920 | $73,710 | $119,210 |
| 2024 | $5,801 | $192,920 | $73,710 | $119,210 |
| 2023 | $5,674 | $192,920 | $73,710 | $119,210 |
| 2022 | $4,706 | $141,190 | $67,480 | $73,710 |
| 2021 | $4,706 | $141,190 | $67,480 | $73,710 |
| 2020 | $4,635 | $141,190 | $67,480 | $73,710 |
| 2019 | $4,635 | $141,190 | $67,480 | $73,710 |
| 2018 | $4,635 | $141,190 | $67,480 | $73,710 |
| 2017 | $4,936 | $145,470 | $71,390 | $74,080 |
| 2016 | $4,892 | $145,470 | $71,390 | $74,080 |
| 2015 | $4,565 | $145,470 | $71,390 | $74,080 |
| 2014 | $4,841 | $145,470 | $71,390 | $74,080 |
Source: Public Records
Map
Nearby Homes
- 14 Wildwood Rd
- 587 Main St
- 17 Oakwood Manor
- 6 Whitney Ct
- 120 Washington Rd
- 12 Fairview Heights
- 20 Evergreen Rd
- 4 Lower Heatherwood
- 4 Lower Heatherwood Unit 4
- 5 Northbridge
- 91 Highview Dr
- 23 Primrose Ln
- 0 Primrose Ln
- 35 Primrose Ln
- 44 Primrose Ln
- 2369 Main St
- 30 Larkspur Dr
- 58 Blackhaw Dr
- 1605 Briarwood Ct Unit 1605
- 15 Oxford Ln
- 25 Raymond Place
- 21 Raymond Place
- 24 Raymond Place
- 19 Raymond Place
- 22 Raymond Place
- 29 Raymond Place
- 20 W Tract Rd
- 22 W Tract Rd
- 16 W Tract Rd
- 18 W Tract Rd
- 23 W Tract Rd
- 24 W Tract Rd
- 12 W Tract Rd
- 8 Botelle Manor
- 31 Raymond Place
- 20 Raymond Place
- 17 Raymond Place
- 14 W Tract Rd
- 10 Botelle Manor
- 33 Raymond Place