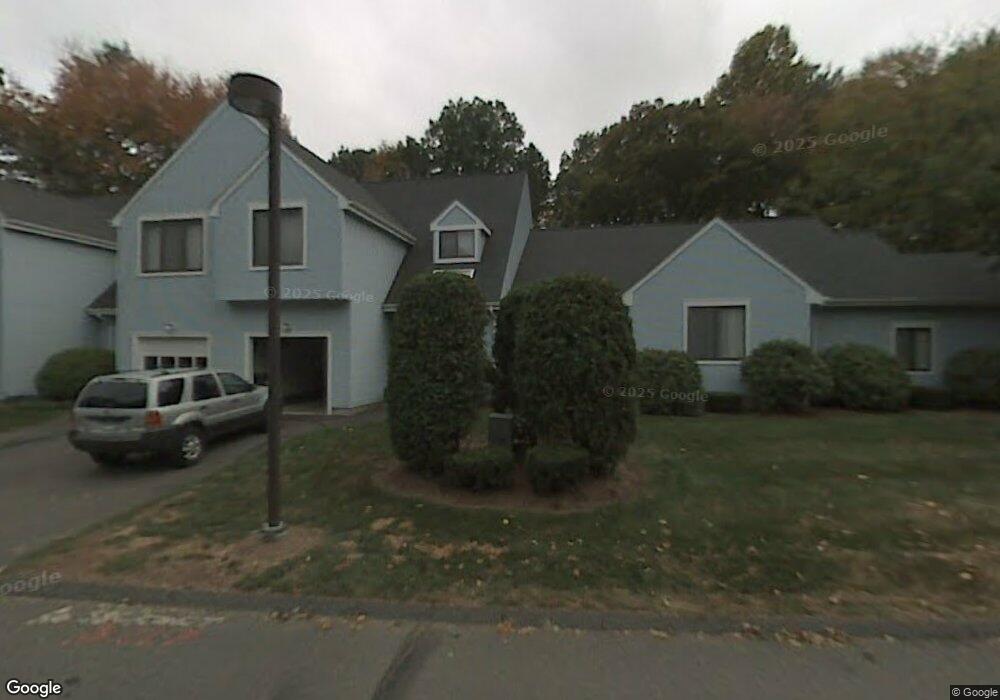
23 Redstone Way Farmington, CT 06032
Estimated Value: $336,000 - $360,000
2
Beds
3
Baths
1,432
Sq Ft
$246/Sq Ft
Est. Value
About This Home
This home is located at 23 Redstone Way, Farmington, CT 06032 and is currently estimated at $352,102, approximately $245 per square foot. 23 Redstone Way is a home located in Hartford County with nearby schools including West Woods Upper Elementary School, Irving A. Robbins Middle School, and Farmington High School.
Ownership History
Date
Name
Owned For
Owner Type
Purchase Details
Closed on
Jul 8, 2014
Sold by
Campbell Marla J
Bought by
Baumann Ryan F
Current Estimated Value
Purchase Details
Closed on
Jul 17, 1998
Sold by
Lima Gloria L
Bought by
Campbell Marla J
Home Financials for this Owner
Home Financials are based on the most recent Mortgage that was taken out on this home.
Original Mortgage
$115,900
Interest Rate
6.98%
Mortgage Type
Purchase Money Mortgage
Purchase Details
Closed on
Mar 26, 1996
Sold by
Weisman Joel
Bought by
Lima Gloria
Home Financials for this Owner
Home Financials are based on the most recent Mortgage that was taken out on this home.
Original Mortgage
$41,000
Interest Rate
6.47%
Mortgage Type
Purchase Money Mortgage
Purchase Details
Closed on
Nov 15, 1995
Sold by
Gomez-Gil Alfredo and Degomez Etsuko Asmami
Bought by
Weisman Joel D
Create a Home Valuation Report for This Property
The Home Valuation Report is an in-depth analysis detailing your home's value as well as a comparison with similar homes in the area
Home Values in the Area
Average Home Value in this Area
Purchase History
| Date | Buyer | Sale Price | Title Company |
|---|---|---|---|
| Baumann Ryan F | -- | -- | |
| Campbell Marla J | $122,000 | -- | |
| Lima Gloria | $115,000 | -- | |
| Weisman Joel D | $102,000 | -- |
Source: Public Records
Mortgage History
| Date | Status | Borrower | Loan Amount |
|---|---|---|---|
| Previous Owner | Weisman Joel D | $108,000 | |
| Previous Owner | Weisman Joel D | $113,298 | |
| Previous Owner | Weisman Joel D | $115,900 | |
| Previous Owner | Weisman Joel D | $41,000 |
Source: Public Records
Tax History Compared to Growth
Tax History
| Year | Tax Paid | Tax Assessment Tax Assessment Total Assessment is a certain percentage of the fair market value that is determined by local assessors to be the total taxable value of land and additions on the property. | Land | Improvement |
|---|---|---|---|---|
| 2025 | $4,670 | $175,420 | $0 | $175,420 |
| 2024 | $4,464 | $175,420 | $0 | $175,420 |
| 2023 | $4,247 | $175,420 | $0 | $175,420 |
| 2022 | $4,301 | $146,700 | $0 | $146,700 |
| 2021 | $4,226 | $146,700 | $0 | $146,700 |
| 2020 | $4,103 | $146,700 | $0 | $146,700 |
| 2019 | $4,103 | $146,700 | $0 | $146,700 |
| 2018 | $3,987 | $146,700 | $0 | $146,700 |
| 2017 | $3,960 | $148,410 | $0 | $148,410 |
| 2016 | $3,826 | $148,410 | $0 | $148,410 |
| 2015 | $3,712 | $148,410 | $0 | $148,410 |
| 2014 | $3,627 | $148,410 | $0 | $148,410 |
Source: Public Records
Map
Nearby Homes
- 6 Cypress Trail
- 4 Locust Ln
- 20 Farm Dr
- 95 Fieldstone Run
- 6 Le Jardin Way
- 5 Le Jardin Way
- 5 Rocky Ridge Ln
- 12 Snowberry Ln
- 11 Wildcat Dr
- 9 Meadow Ln
- 1 Sable Ct
- 2 Silver Charm Way
- 15 Old Village Ln
- 6 Burlington Rd
- 61 Litchfield Rd
- 16 Brightwood Rd
- 224 New Britain Ave Unit 14
- 4 Grandview Dr Unit 49A
- 52 Plank Hill Rd
- 1622 Farmington Ave Unit 4
- 25 Redstone Way
- 24 Redstone Way
- 24 Redstone Way Unit 24
- 24 Redstone Way Unit 54
- 23 Redstone Way Unit 23
- 1 Redstone Way
- 22 Redstone Way
- 22 Field Rock Rd
- 21 Redstone Way
- 20 Redstone Way
- 20 Redstone Way Unit 20
- 2 Redstone Way
- 2 Redstone Way Unit 2
- 1 Field Rock Rd
- 39 Fieldstone Run
- 21 Field Rock Rd
- 3 Field Rock Rd
- 2 Field Rock Rd
- 2 Field Rock Rd Unit 2
- 23 Field Rock Rd