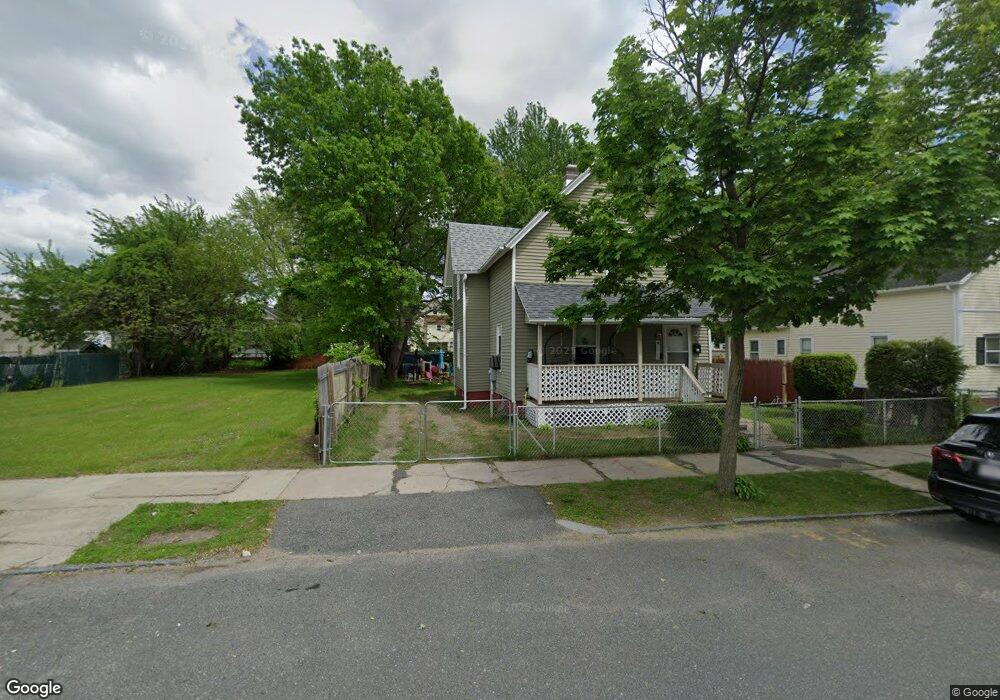
23 Reed St Springfield, MA 01109
Upper Hill NeighborhoodEstimated Value: $221,522
5
Beds
2
Baths
3,330
Sq Ft
$67/Sq Ft
Est. Value
About This Home
This home is located at 23 Reed St, Springfield, MA 01109 and is currently estimated at $221,522, approximately $66 per square foot. 23 Reed St is a home located in Hampden County with nearby schools including M Marcus Kiley Middle, Springfield High School of Science and Technology, and Roger L. Putnam Vocational Technical Academy.
Ownership History
Date
Name
Owned For
Owner Type
Purchase Details
Closed on
Jun 25, 2004
Sold by
Brightwell David A and Robinson Marie
Bought by
Estrella Julio C
Current Estimated Value
Home Financials for this Owner
Home Financials are based on the most recent Mortgage that was taken out on this home.
Original Mortgage
$94,500
Outstanding Balance
$47,519
Interest Rate
6.32%
Mortgage Type
Purchase Money Mortgage
Estimated Equity
$174,003
Create a Home Valuation Report for This Property
The Home Valuation Report is an in-depth analysis detailing your home's value as well as a comparison with similar homes in the area
Home Values in the Area
Average Home Value in this Area
Purchase History
| Date | Buyer | Sale Price | Title Company |
|---|---|---|---|
| Estrella Julio C | $105,000 | -- |
Source: Public Records
Mortgage History
| Date | Status | Borrower | Loan Amount |
|---|---|---|---|
| Open | Estrella Julio C | $94,500 |
Source: Public Records
Tax History Compared to Growth
Tax History
| Year | Tax Paid | Tax Assessment Tax Assessment Total Assessment is a certain percentage of the fair market value that is determined by local assessors to be the total taxable value of land and additions on the property. | Land | Improvement |
|---|---|---|---|---|
| 2025 | $0 | $31,500 | $31,500 | $0 |
| 2024 | $0 | $31,500 | $31,500 | $0 |
| 2023 | $0 | $28,700 | $28,700 | $0 |
| 2022 | $1,471 | $88,100 | $26,800 | $61,300 |
| 2021 | $0 | $88,100 | $19,000 | $69,100 |
| 2020 | -- | $88,100 | $19,000 | $69,100 |
| 2019 | $0 | $88,100 | $16,200 | $71,900 |
| 2018 | $0 | $88,100 | $15,700 | $72,400 |
| 2017 | $0 | $88,100 | $15,200 | $72,900 |
| 2016 | $1,471 | $74,800 | $15,200 | $59,600 |
| 2015 | $1,436 | $73,000 | $15,200 | $57,800 |
Source: Public Records
Map
Nearby Homes
- 43 Colonial Ave
- 58 Willard Ave
- 62-64 Bristol St
- 15 Kenyon St
- 19 Westford Ave
- 67 Carlisle St
- 111 Marlborough St
- 65 Montrose St
- 88 Dunmoreland St
- 135-137 Suffolk St
- 124-126 Westford Cir
- 52-56 Andrew St
- 158 Norfolk St
- 81 Hayden Ave
- 179 Albemarle St
- 93 Dawes St
- 90 Cambridge St
- 21 Westford Cir
- 140 Northampton Ave
- 867 Roosevelt Ave