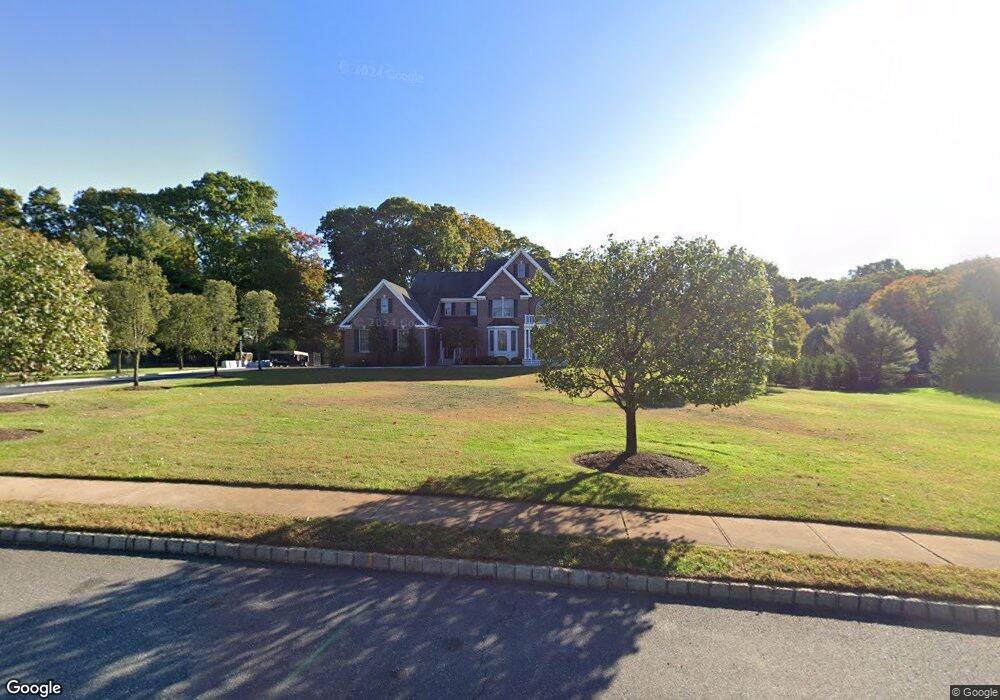
23 Rifkin Ct Manalapan, NJ 07726
Estimated Value: $1,443,821 - $1,536,000
4
Beds
3
Baths
4,684
Sq Ft
$317/Sq Ft
Est. Value
About This Home
This home is located at 23 Rifkin Ct, Manalapan, NJ 07726 and is currently estimated at $1,485,955, approximately $317 per square foot. 23 Rifkin Ct is a home located in Monmouth County with nearby schools including Taylor Mills Elementary School, Manalapan-Englishtown Middle School, and Pine Brook Elementary School.
Ownership History
Date
Name
Owned For
Owner Type
Purchase Details
Closed on
Feb 8, 2008
Sold by
Wong Kevin M and Ling Susanna Y S
Bought by
Mandato Arthur D and Mandato Anita
Current Estimated Value
Home Financials for this Owner
Home Financials are based on the most recent Mortgage that was taken out on this home.
Original Mortgage
$600,000
Outstanding Balance
$375,283
Interest Rate
5.9%
Mortgage Type
Purchase Money Mortgage
Estimated Equity
$1,110,672
Purchase Details
Closed on
May 11, 2007
Sold by
Brookside At Manalapan Llc
Bought by
Wong Kevin M and Ling Susanna Y S
Home Financials for this Owner
Home Financials are based on the most recent Mortgage that was taken out on this home.
Original Mortgage
$740,800
Interest Rate
7.75%
Mortgage Type
Purchase Money Mortgage
Create a Home Valuation Report for This Property
The Home Valuation Report is an in-depth analysis detailing your home's value as well as a comparison with similar homes in the area
Home Values in the Area
Average Home Value in this Area
Purchase History
| Date | Buyer | Sale Price | Title Company |
|---|---|---|---|
| Mandato Arthur D | $853,000 | Red Bank Title Agency Inc | |
| Wong Kevin M | $987,765 | None Available |
Source: Public Records
Mortgage History
| Date | Status | Borrower | Loan Amount |
|---|---|---|---|
| Open | Mandato Arthur D | $600,000 | |
| Previous Owner | Wong Kevin M | $740,800 |
Source: Public Records
Tax History Compared to Growth
Tax History
| Year | Tax Paid | Tax Assessment Tax Assessment Total Assessment is a certain percentage of the fair market value that is determined by local assessors to be the total taxable value of land and additions on the property. | Land | Improvement |
|---|---|---|---|---|
| 2025 | $19,343 | $1,208,800 | $385,900 | $822,900 |
| 2024 | $18,626 | $1,145,900 | $313,900 | $832,000 |
| 2023 | $18,626 | $1,120,000 | $307,400 | $812,600 |
| 2022 | $18,902 | $1,021,600 | $237,400 | $784,200 |
| 2021 | $18,902 | $907,900 | $202,400 | $705,500 |
| 2020 | $17,753 | $861,800 | $152,400 | $709,400 |
| 2019 | $17,604 | $853,300 | $152,400 | $700,900 |
| 2018 | $17,183 | $827,700 | $152,400 | $675,300 |
| 2017 | $16,822 | $810,700 | $152,400 | $658,300 |
| 2016 | $17,650 | $859,300 | $202,400 | $656,900 |
| 2015 | $17,629 | $849,200 | $202,400 | $646,800 |
| 2014 | $16,569 | $777,900 | $203,800 | $574,100 |
Source: Public Records
Map
Nearby Homes