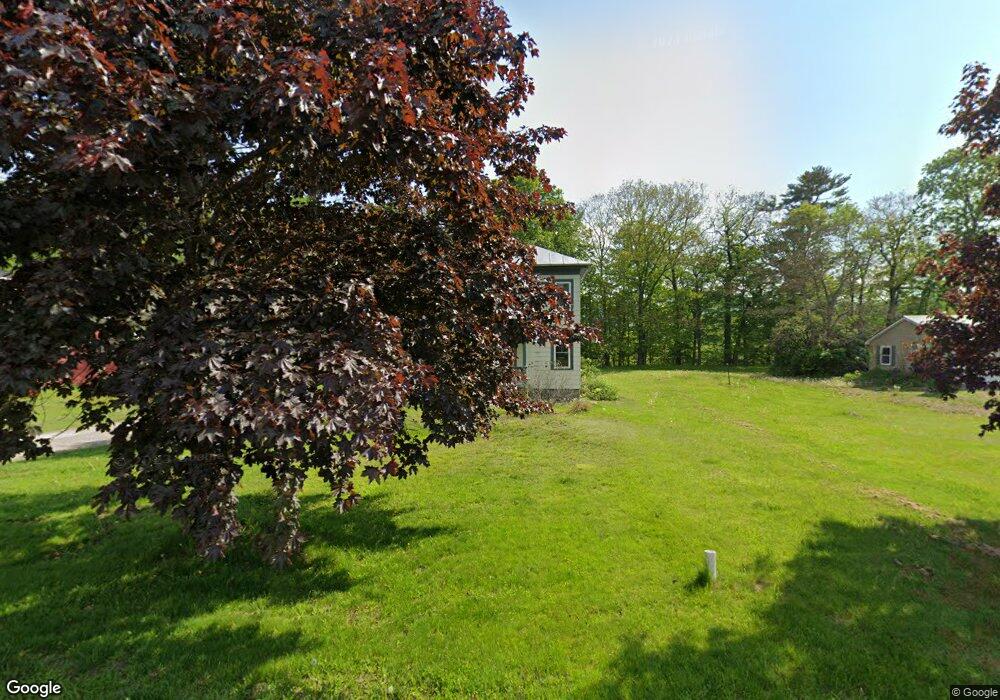
23 River St Strong, ME 04983
Estimated Value: $167,000 - $186,814
3
Beds
1
Bath
1,236
Sq Ft
$141/Sq Ft
Est. Value
About This Home
This home is located at 23 River St, Strong, ME 04983 and is currently estimated at $173,704, approximately $140 per square foot. 23 River St is a home located in Franklin County with nearby schools including Mt. Abram Regional High School.
Ownership History
Date
Name
Owned For
Owner Type
Purchase Details
Closed on
Jul 28, 2023
Sold by
23 R S Land T R and 23 Ellis
Bought by
Standwood Brandon L and Littlefield Derick R
Current Estimated Value
Home Financials for this Owner
Home Financials are based on the most recent Mortgage that was taken out on this home.
Original Mortgage
$163,680
Outstanding Balance
$158,869
Interest Rate
6.69%
Mortgage Type
FHA
Estimated Equity
$14,835
Purchase Details
Closed on
Jul 25, 2018
Sold by
Odonnell David C
Bought by
23 R S Land T
Purchase Details
Closed on
May 1, 2008
Sold by
Odonnell Joseph F and Odonnell David C
Bought by
Odonnell David C and Odonnell Chelsea L
Home Financials for this Owner
Home Financials are based on the most recent Mortgage that was taken out on this home.
Original Mortgage
$60,620
Interest Rate
5.91%
Mortgage Type
FHA
Create a Home Valuation Report for This Property
The Home Valuation Report is an in-depth analysis detailing your home's value as well as a comparison with similar homes in the area
Purchase History
| Date | Buyer | Sale Price | Title Company |
|---|---|---|---|
| Standwood Brandon L | $166,700 | None Available | |
| 23 R S Land T | -- | -- | |
| Odonnell David C | -- | -- |
Source: Public Records
Mortgage History
| Date | Status | Borrower | Loan Amount |
|---|---|---|---|
| Open | Standwood Brandon L | $163,680 | |
| Previous Owner | Odonnell David C | $63,200 | |
| Previous Owner | Odonnell David C | $60,620 | |
| Previous Owner | Odonnell David C | $46,600 |
Source: Public Records
Tax History
| Year | Tax Paid | Tax Assessment Tax Assessment Total Assessment is a certain percentage of the fair market value that is determined by local assessors to be the total taxable value of land and additions on the property. | Land | Improvement |
|---|---|---|---|---|
| 2025 | $1,297 | $67,910 | $25,000 | $42,910 |
| 2024 | $1,195 | $67,910 | $25,000 | $42,910 |
| 2023 | $1,087 | $67,910 | $25,000 | $42,910 |
| 2022 | $1,073 | $67,910 | $25,000 | $42,910 |
| 2021 | $1,121 | $67,910 | $25,000 | $42,910 |
| 2020 | $1,161 | $67,910 | $25,000 | $42,910 |
| 2019 | $1,209 | $67,910 | $25,000 | $42,910 |
| 2018 | $1,053 | $67,910 | $25,000 | $42,910 |
| 2017 | $978 | $67,910 | $25,000 | $42,910 |
| 2016 | $964 | $67,910 | $25,000 | $42,910 |
| 2015 | $998 | $67,910 | $25,000 | $42,910 |
| 2013 | $869 | $67,910 | $25,000 | $42,910 |
Source: Public Records
Map
Nearby Homes
- 29 River St
- 44 Norton Hill Rd
- 12 Shady Ln
- R-5 13-A Norton Hill Rd
- MR11 L35 Burbank Hill Rd
- 43 Brookside Ln
- 722 Farmington Rd
- 530 Foster Hill Rd
- Lot 12 Barker Rd
- Lot 21 River Rd
- 97 Lake St
- R6L38B New Vineyard Rd
- 55 Lake St
- MR7 L31&37 Taylor Hill Rd
- 33 Lake St
- 4 Cousineaus Tory Hill Heights
- 152 Johnson Rd
- 372 River Rd
- 150 River
- Lot 006 Ramsdell Rd
- 25 River St
- 17 River St
- 35 River St
- 40 River St
- 6 River St
- 41 River St
- 0 Route 234 Unit 856288
- 0 Route 234 Unit 825746
- 0 Route 234 Unit 786450
- 0 Route 234 Unit 751340
- 0 Route 234 Unit 751033
- 0 Route 234 Unit 708408
- 0 Route 234 Unit 705087
- 0 Route 234 Unit 277411
- 00 Rte 234
- 0 Route 234 Unit 1062617
- 0 Route 234 Unit 1027703
- 0 Route 234 Unit 984957
- 27 S Strong Rd
- 8B1 S Strong Rd
Your Personal Tour Guide
Ask me questions while you tour the home.