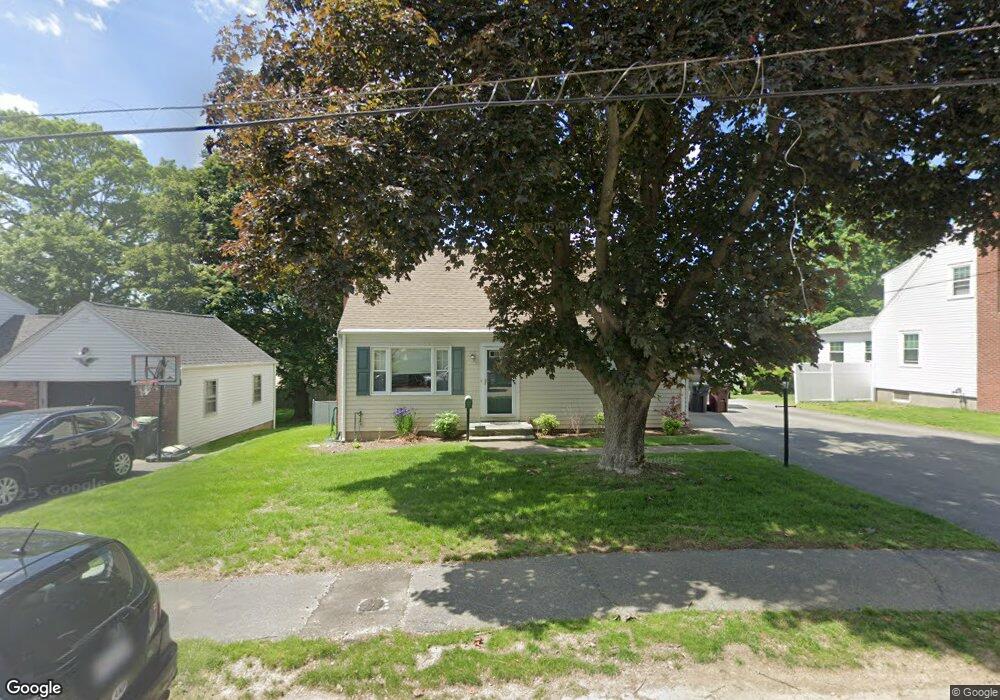
23 Robinwood Rd Dedham, MA 02026
Oakdale NeighborhoodEstimated Value: $678,000 - $775,662
3
Beds
2
Baths
1,712
Sq Ft
$429/Sq Ft
Est. Value
About This Home
This home is located at 23 Robinwood Rd, Dedham, MA 02026 and is currently estimated at $734,416, approximately $428 per square foot. 23 Robinwood Rd is a home located in Norfolk County with nearby schools including Oakdale Elementary School, Dedham Middle School, and Dedham High School.
Ownership History
Date
Name
Owned For
Owner Type
Purchase Details
Closed on
Jul 30, 2010
Sold by
Omalley Martin J and Omalley Diane M
Bought by
Omalley Martin J
Current Estimated Value
Purchase Details
Closed on
Jun 28, 1995
Sold by
Oleary Daniel P
Bought by
Omalley Martin J and Omalley Diane M
Home Financials for this Owner
Home Financials are based on the most recent Mortgage that was taken out on this home.
Original Mortgage
$115,000
Interest Rate
7.8%
Mortgage Type
Purchase Money Mortgage
Purchase Details
Closed on
Oct 31, 1990
Sold by
Dirienzo Alice A
Bought by
Oleary Daniel P
Home Financials for this Owner
Home Financials are based on the most recent Mortgage that was taken out on this home.
Original Mortgage
$90,000
Interest Rate
10.07%
Mortgage Type
Purchase Money Mortgage
Create a Home Valuation Report for This Property
The Home Valuation Report is an in-depth analysis detailing your home's value as well as a comparison with similar homes in the area
Home Values in the Area
Average Home Value in this Area
Purchase History
| Date | Buyer | Sale Price | Title Company |
|---|---|---|---|
| Omalley Martin J | -- | -- | |
| Omalley Martin J | $130,000 | -- | |
| Oleary Daniel P | $137,000 | -- |
Source: Public Records
Mortgage History
| Date | Status | Borrower | Loan Amount |
|---|---|---|---|
| Open | Oleary Daniel P | $150,000 | |
| Previous Owner | Oleary Daniel P | $110,000 | |
| Previous Owner | Oleary Daniel P | $115,000 | |
| Previous Owner | Oleary Daniel P | $90,000 |
Source: Public Records
Tax History
| Year | Tax Paid | Tax Assessment Tax Assessment Total Assessment is a certain percentage of the fair market value that is determined by local assessors to be the total taxable value of land and additions on the property. | Land | Improvement |
|---|---|---|---|---|
| 2025 | $8,444 | $669,100 | $345,000 | $324,100 |
| 2024 | $8,269 | $661,500 | $312,900 | $348,600 |
| 2023 | $7,820 | $609,000 | $283,400 | $325,600 |
| 2022 | $7,385 | $553,200 | $266,100 | $287,100 |
| 2021 | $6,778 | $495,800 | $246,400 | $249,400 |
| 2020 | $6,697 | $488,100 | $246,500 | $241,600 |
| 2019 | $6,234 | $440,600 | $214,300 | $226,300 |
| 2018 | $5,931 | $407,600 | $187,300 | $220,300 |
| 2017 | $5,839 | $395,600 | $175,300 | $220,300 |
| 2016 | $5,693 | $367,500 | $162,300 | $205,200 |
| 2015 | $5,628 | $354,600 | $162,000 | $192,600 |
| 2014 | $5,811 | $361,400 | $159,000 | $202,400 |
Source: Public Records
Map
Nearby Homes
- 8 Hillview Terrace
- 14 Eldridge Place
- 186 Carroll Ave
- 21 Birch St
- 6 Snow Ln
- 59 Grafton Ave
- 290 East St
- 213 Sandy Valley Rd
- 59 Hamilton Ave
- 165 Highland St Unit 165
- 58 Jersey St
- 926 East St
- 600 East St
- 50 Sprague St
- 39 Westbrook Ln
- 107 Horrigan Dr Unit 12
- 86 Horrigan Dr Unit 23
- 44 Court St
- 66 Horrigan Dr Unit 25
- 80 Horrigan Dr Unit 24
- 19 Robinwood Rd
- 29 Robinwood Rd
- 20 Robinwood Rd
- 35 Robinwood Rd
- 165 Elm St
- 157 Elm St
- 11 Robinwood Rd
- 11 Robinwood Rd Unit 1
- 41 Robinwood Rd
- 34 Robinwood Rd
- 28 Robinwood Rd
- 40 Robinwood Rd
- 185 Elm St
- 189 Elm St
- 189 Elm St Unit 1
- 68 Robinwood Rd
- 74 Robinwood Rd
- 80 Robinwood Rd
- 193 Elm St
- 86 Robinwood Rd
Your Personal Tour Guide
Ask me questions while you tour the home.