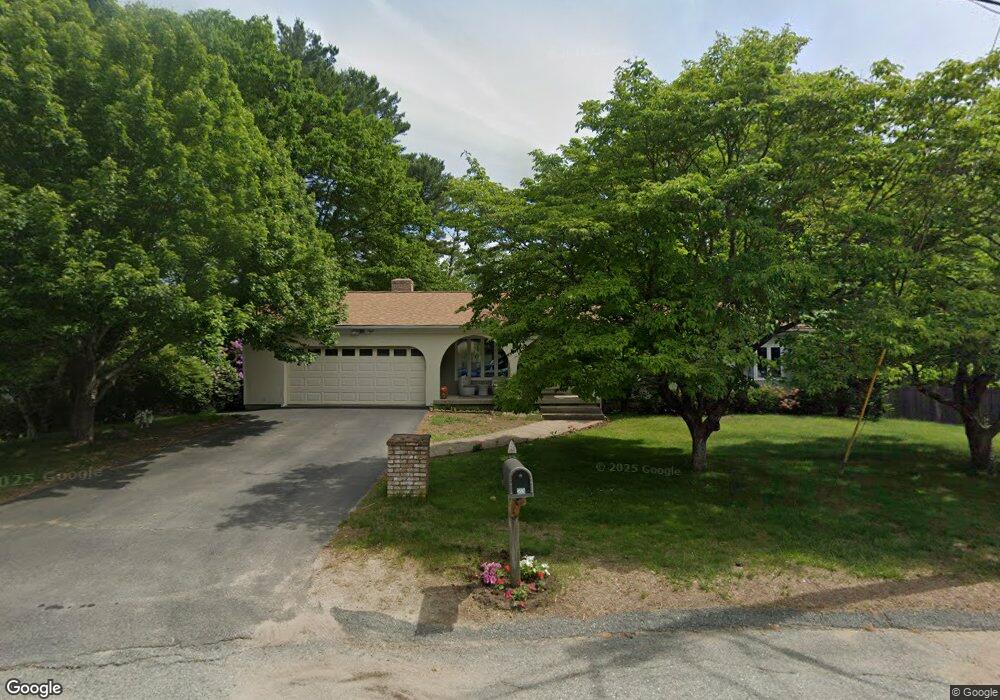
23 Roger Williams St Smithfield, RI 02828
Bishop Heights NeighborhoodEstimated Value: $591,072 - $635,000
4
Beds
6
Baths
2,624
Sq Ft
$233/Sq Ft
Est. Value
About This Home
This home is located at 23 Roger Williams St, Smithfield, RI 02828 and is currently estimated at $611,268, approximately $232 per square foot. 23 Roger Williams St is a home located in Providence County with nearby schools including William Winsor Elementary School, Vincent J. Gallagher Middle School, and Smithfield High School.
Ownership History
Date
Name
Owned For
Owner Type
Purchase Details
Closed on
Sep 9, 2021
Sold by
Sahyouni Abed H
Bought by
Sahyouni Abed H and Sahyouni Iman
Current Estimated Value
Purchase Details
Closed on
Dec 29, 2014
Sold by
Mccutcheon Buce J and Hsbc Bank Usa Na
Bought by
Hsbc Bank Usa Na
Purchase Details
Closed on
Apr 30, 2007
Sold by
Boyes Robert W and Boyes Patricia A
Bought by
Mccutcheon Bruce J and Mccutcheon Hope F
Home Financials for this Owner
Home Financials are based on the most recent Mortgage that was taken out on this home.
Original Mortgage
$306,000
Interest Rate
6.18%
Mortgage Type
Purchase Money Mortgage
Purchase Details
Closed on
Nov 22, 2000
Sold by
Larose Edward J and Larose Cynthia
Bought by
Boyes Robert W and Boyes Patricia
Create a Home Valuation Report for This Property
The Home Valuation Report is an in-depth analysis detailing your home's value as well as a comparison with similar homes in the area
Home Values in the Area
Average Home Value in this Area
Purchase History
| Date | Buyer | Sale Price | Title Company |
|---|---|---|---|
| Sahyouni Abed H | -- | None Available | |
| Sahyouni Abed H | -- | None Available | |
| Sahyouni Abed H | -- | None Available | |
| Hsbc Bank Usa Na | $261,000 | -- | |
| Hsbc Bank Usa Na | $261,000 | -- | |
| Mccutcheon Bruce J | $34,000 | -- | |
| Mccutcheon Bruce J | $34,000 | -- | |
| Boyes Robert W | $210,500 | -- | |
| Boyes Robert W | $210,500 | -- |
Source: Public Records
Mortgage History
| Date | Status | Borrower | Loan Amount |
|---|---|---|---|
| Previous Owner | Boyes Robert W | $306,000 |
Source: Public Records
Tax History Compared to Growth
Tax History
| Year | Tax Paid | Tax Assessment Tax Assessment Total Assessment is a certain percentage of the fair market value that is determined by local assessors to be the total taxable value of land and additions on the property. | Land | Improvement |
|---|---|---|---|---|
| 2025 | $6,828 | $551,100 | $151,600 | $399,500 |
| 2024 | $5,747 | $398,000 | $128,600 | $269,400 |
| 2023 | $5,461 | $398,000 | $128,600 | $269,400 |
| 2022 | $5,317 | $398,000 | $128,600 | $269,400 |
| 2021 | $5,494 | $320,700 | $116,800 | $203,900 |
| 2020 | $5,391 | $320,700 | $116,800 | $203,900 |
| 2019 | $5,391 | $320,700 | $116,800 | $203,900 |
| 2018 | $5,150 | $293,300 | $103,900 | $189,400 |
| 2017 | $5,150 | $293,300 | $103,900 | $189,400 |
| 2016 | $4,907 | $293,300 | $103,900 | $189,400 |
| 2015 | $4,944 | $281,400 | $98,500 | $182,900 |
| 2012 | $4,830 | $301,500 | $115,100 | $186,400 |
Source: Public Records
Map
Nearby Homes
- 2 Fairview Dr
- 28 Lakeview Dr
- 62 Orchard Ave
- 66 Orchard Ave
- 965 Greenville Ave
- 18 Shady Brook Cove Rd
- 936 Greenville Ave
- 15 Chiswick Rd
- 2 Hattie Ave
- 563 Putnam Pike
- 4 Fair Oaks Ct N
- 14 Douglas Cir
- 125 Smith Ave Unit 1B
- 5 Pleasant View Cir
- 3 Juniper Ln
- 112 Winsor Ave
- 110 Hopkins Ave
- 13 Willow Rd
- 494 Putnam Pike Unit A12
- 494 Putnam Pike Unit A1
- 23 Roger Williams Dr
- 21 Roger Williams Dr
- 25 Roger Williams Dr
- 27 Coolridge Ave
- 19 Roger Williams Dr
- 24 Roger Williams Dr
- 25 Coolridge Ave
- 27 Roger Williams Dr
- 22 Roger Williams Dr
- 93 Coolridge Ave
- 89 Coolridge Ave
- 85 Coolridge Ave
- 89 Coolridge Ave
- 17 Roger Williams Dr
- 20 Roger Williams Dr
- 34 Coolridge Ave
- 32 Coolridge Ave
- 36 Coolridge Ave
- 38 Coolridge Ave
- 29 Roger Williams Dr