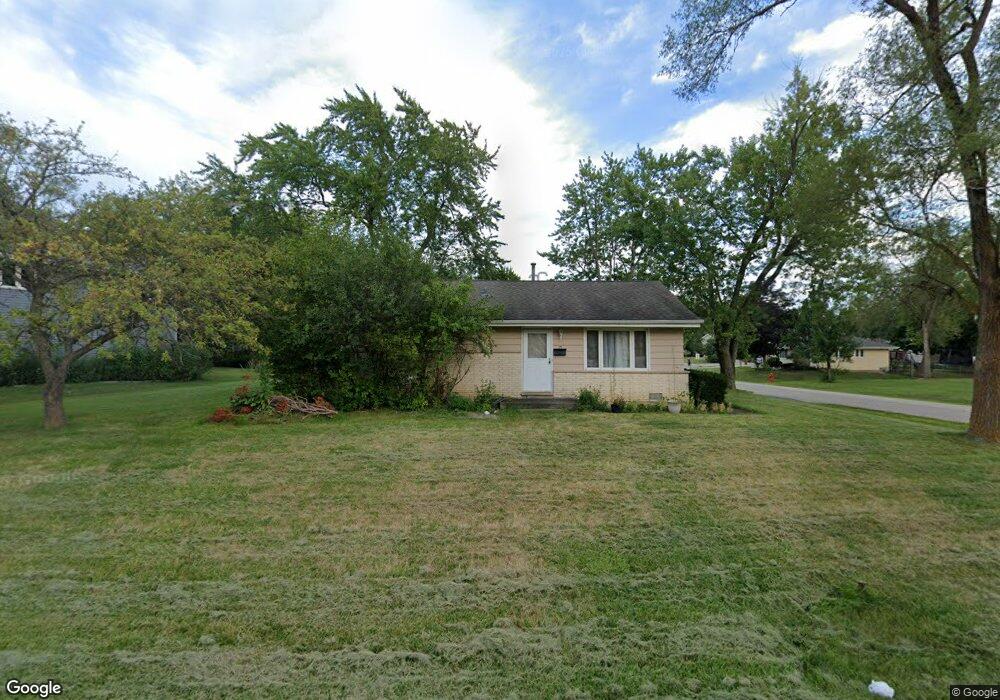
23 Rugby Rd Lake Zurich, IL 60047
Estimated Value: $286,000 - $338,860
3
Beds
1
Bath
1,155
Sq Ft
$269/Sq Ft
Est. Value
About This Home
This home is located at 23 Rugby Rd, Lake Zurich, IL 60047 and is currently estimated at $310,715, approximately $269 per square foot. 23 Rugby Rd is a home located in Lake County with nearby schools including Seth Paine Elementary School, Lake Zurich Middle School North, and Lake Zurich High School.
Ownership History
Date
Name
Owned For
Owner Type
Purchase Details
Closed on
Mar 3, 2010
Sold by
Citibank Na
Bought by
Jha Alok and Jha Meena
Current Estimated Value
Purchase Details
Closed on
Aug 19, 2009
Sold by
Eldridge Kenneth W and National City Bank
Bought by
Citibank Na
Purchase Details
Closed on
Jun 15, 2006
Sold by
Weprin Janeane
Bought by
Eldridge Kenneth W
Home Financials for this Owner
Home Financials are based on the most recent Mortgage that was taken out on this home.
Original Mortgage
$199,200
Interest Rate
7.87%
Mortgage Type
Purchase Money Mortgage
Purchase Details
Closed on
Sep 8, 1995
Sold by
Schultz Dolores and Schultz Dolores A
Bought by
Weprin Janeane
Home Financials for this Owner
Home Financials are based on the most recent Mortgage that was taken out on this home.
Original Mortgage
$100,800
Interest Rate
7.76%
Create a Home Valuation Report for This Property
The Home Valuation Report is an in-depth analysis detailing your home's value as well as a comparison with similar homes in the area
Home Values in the Area
Average Home Value in this Area
Purchase History
| Date | Buyer | Sale Price | Title Company |
|---|---|---|---|
| Jha Alok | $125,000 | None Available | |
| Citibank Na | -- | None Available | |
| Eldridge Kenneth W | $249,000 | Fidelity Natl Title Ins Co | |
| Weprin Janeane | $126,000 | Chicago Title Insurance Co |
Source: Public Records
Mortgage History
| Date | Status | Borrower | Loan Amount |
|---|---|---|---|
| Previous Owner | Eldridge Kenneth W | $199,200 | |
| Previous Owner | Weprin Janeane | $100,800 |
Source: Public Records
Tax History Compared to Growth
Tax History
| Year | Tax Paid | Tax Assessment Tax Assessment Total Assessment is a certain percentage of the fair market value that is determined by local assessors to be the total taxable value of land and additions on the property. | Land | Improvement |
|---|---|---|---|---|
| 2024 | $5,852 | $89,743 | $20,418 | $69,325 |
| 2023 | $5,329 | $82,389 | $18,745 | $63,644 |
| 2022 | $5,329 | $73,643 | $13,897 | $59,746 |
| 2021 | $5,139 | $71,756 | $13,541 | $58,215 |
| 2020 | $5,046 | $71,756 | $13,541 | $58,215 |
| 2019 | $4,970 | $71,130 | $13,423 | $57,707 |
| 2018 | $3,897 | $57,290 | $14,441 | $42,849 |
| 2017 | $3,869 | $56,600 | $14,267 | $42,333 |
| 2016 | $4,249 | $54,808 | $13,815 | $40,993 |
| 2015 | $4,199 | $52,203 | $13,158 | $39,045 |
| 2014 | $3,744 | $46,025 | $13,223 | $32,802 |
| 2012 | $3,117 | $47,921 | $13,251 | $34,670 |
Source: Public Records
Map
Nearby Homes
- 0 Manchester Rd Unit MRD12503617
- 62 Miller Rd
- 64 Miller Rd
- 900 Winnetka Terrace
- 15 S Wynstone Dr
- 1101 Geneva Ln Unit B
- 100 Clubhouse Ln Unit B206
- 455 Eton Dr
- 95 Beech Dr
- 68 Beech Dr
- 14 Beech Dr
- 1028 Aspen Ct
- 1221 Honey Lake Rd
- 39 Deverell Dr
- 1 Kensington Dr
- 1073 Poplar Ct
- 34 Lakeview Place Unit B36C
- 47 Church St
- 1162 Sycamore Dr
- 240 Oxford Rd
- 25 Rugby Rd
- 279 Pine Tree Row
- 282 Pine Tree Row
- 27 Rugby Rd
- 24 Rugby Rd
- 275 Pine Tree Row Unit 2
- 266 Pine Tree Row Unit 2
- 26 Rugby Rd
- 19 Rugby Rd
- 29 Rugby Rd
- 271 Pine Tree Row
- 12 Prospect Rd
- 28 Rugby Rd
- 260 Pine Tree Row
- 10 Prospect Rd
- 10 Hollycourt Terrace
- 267 Pine Tree Row
- 8 Prospect Rd
- 17 Rugby Rd
- 2 Willow Terrace