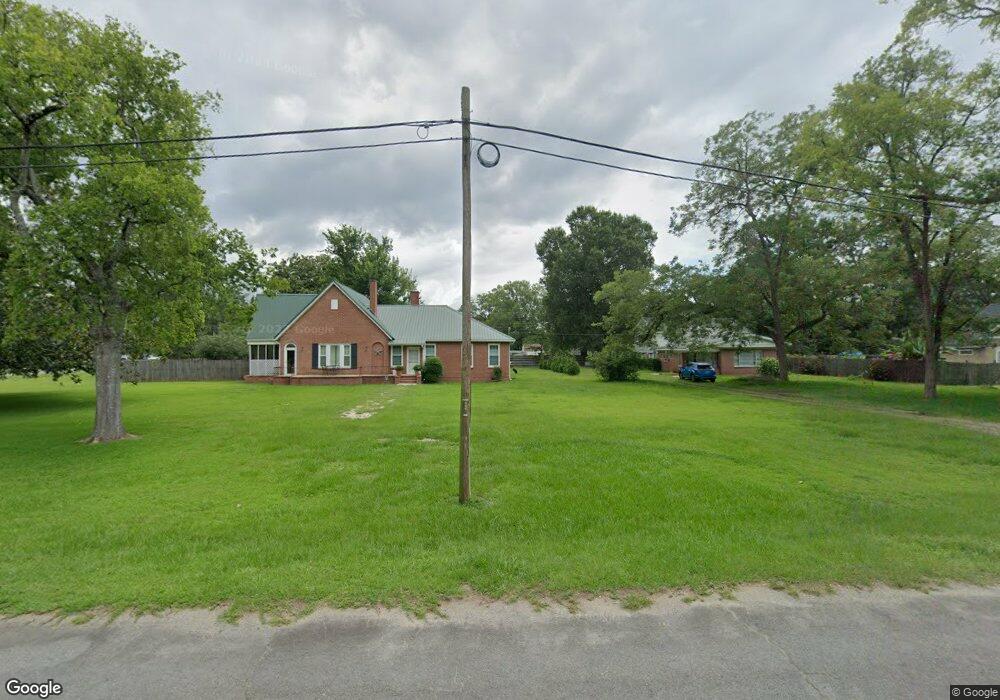
23 S Macon St Reynolds, GA 31076
Estimated Value: $124,000 - $165,000
--
Bed
1
Bath
2,692
Sq Ft
$51/Sq Ft
Est. Value
About This Home
This home is located at 23 S Macon St, Reynolds, GA 31076 and is currently estimated at $136,681, approximately $50 per square foot. 23 S Macon St is a home located in Taylor County with nearby schools including Taylor County Upper Elementary School, Taylor County Primary School, and Taylor County Middle School.
Ownership History
Date
Name
Owned For
Owner Type
Purchase Details
Closed on
Oct 29, 2019
Sold by
Griffin Charles Mitchell
Bought by
Griffin Jason
Current Estimated Value
Home Financials for this Owner
Home Financials are based on the most recent Mortgage that was taken out on this home.
Original Mortgage
$58,300
Outstanding Balance
$51,340
Interest Rate
3.65%
Estimated Equity
$85,341
Purchase Details
Closed on
Apr 15, 2016
Sold by
Mcphail Michael T
Bought by
Griffin Charles Mitchell
Home Financials for this Owner
Home Financials are based on the most recent Mortgage that was taken out on this home.
Original Mortgage
$27,403
Interest Rate
3.73%
Mortgage Type
Commercial
Purchase Details
Closed on
Jan 25, 2011
Sold by
Mcphail Gayle Aultman
Bought by
Mcphail Michael T and Mcphail Ashley L
Purchase Details
Closed on
Jun 10, 2010
Sold by
Aultman Robert Stephen
Bought by
Mcphail Gayle Aultman
Create a Home Valuation Report for This Property
The Home Valuation Report is an in-depth analysis detailing your home's value as well as a comparison with similar homes in the area
Home Values in the Area
Average Home Value in this Area
Purchase History
| Date | Buyer | Sale Price | Title Company |
|---|---|---|---|
| Griffin Jason | $72,875 | -- | |
| Griffin Charles Mitchell | $29,000 | -- | |
| Mcphail Michael T | -- | -- | |
| Mcphail Gayle Aultman | -- | -- | |
| Mcphail Gayle Aultman | -- | -- |
Source: Public Records
Mortgage History
| Date | Status | Borrower | Loan Amount |
|---|---|---|---|
| Open | Griffin Jason | $58,300 | |
| Previous Owner | Griffin Charles Mitchell | $27,403 |
Source: Public Records
Tax History Compared to Growth
Tax History
| Year | Tax Paid | Tax Assessment Tax Assessment Total Assessment is a certain percentage of the fair market value that is determined by local assessors to be the total taxable value of land and additions on the property. | Land | Improvement |
|---|---|---|---|---|
| 2024 | $1,945 | $49,720 | $2,160 | $47,560 |
| 2023 | $1,558 | $38,440 | $2,160 | $36,280 |
| 2022 | $1,079 | $42,920 | $2,160 | $40,760 |
| 2021 | $1,035 | $40,160 | $2,160 | $38,000 |
| 2020 | $756 | $40,160 | $2,160 | $38,000 |
| 2019 | $1,131 | $43,120 | $2,160 | $40,960 |
| 2018 | $1,482 | $43,120 | $2,160 | $40,960 |
| 2017 | $1,126 | $43,950 | $4,275 | $39,675 |
| 2016 | $1,077 | $41,872 | $4,275 | $37,597 |
| 2015 | -- | $41,872 | $4,275 | $37,597 |
| 2014 | -- | $30,875 | $3,780 | $27,095 |
| 2013 | -- | $35,288 | $4,200 | $31,088 |
Source: Public Records
Map
Nearby Homes
- 46 E Calhoun St
- 29 Mimms St
- 25 W Marion St
- 9 Friar Tuck Rd
- 67 N Collins St
- 160 Underwood Rd
- 30 Potterville Main St
- 30 Pottervile Main St
- 296 Boxwood Rd
- Cummings Rd
- 708 Tommy Purvis Junior Rd
- 1800 Cummings Rd
- 0 Oak Ridge Dr
- 000 Avera Rd
- 246 Wilville Rd
- Parcel 1 Whipporwill Rd
- 60 Booker Montgomery Rd
- 2 Forest Ave
- 13 Marshall St
- 1446 Avera Rd
- 21 S Macon St
- 28 S Collins St
- 28 E Calhoun St
- E E Haynes St
- 31 S Macon St
- 28 S Macon St
- 10 E Calhoun St
- 35 S Macon St
- 32 S Collins St
- E E Calhoun St
- 37 S Macon St
- 203 S Collins St
- 27 S Winston St
- 31 S Winston St
- 8 E Calhoun St
- 41 S Macon St
- 310 E Calhoun St
- 37 S Winston St
- 38 S Macon St
- 9 S Collins St