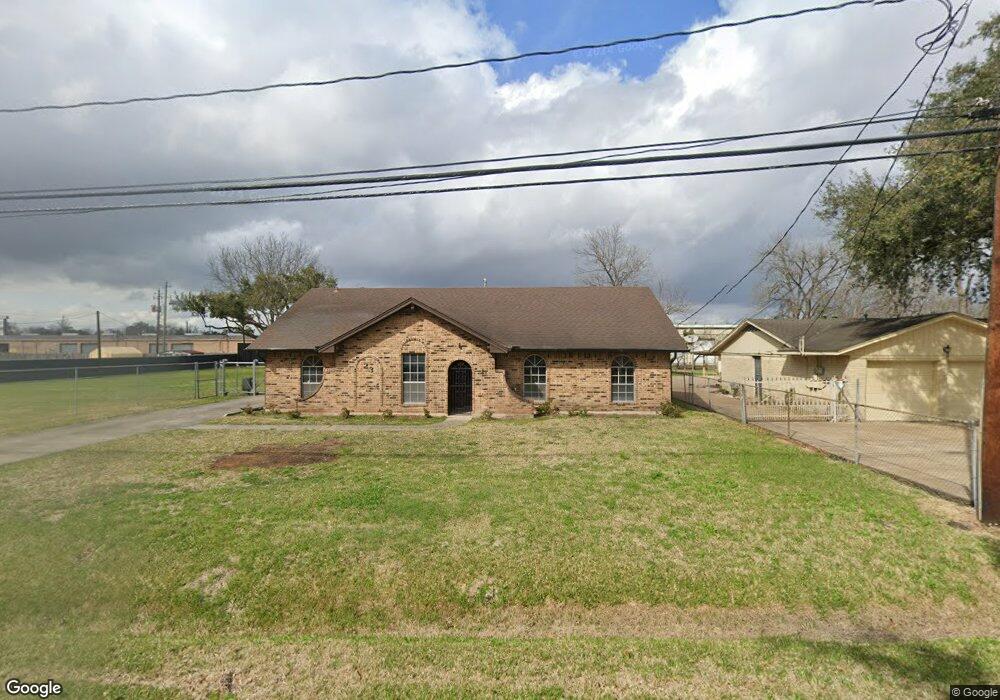
23 Salerno Ln Houston, TX 77076
Northside-Northline NeighborhoodEstimated Value: $189,000 - $534,000
4
Beds
5
Baths
2,300
Sq Ft
$183/Sq Ft
Est. Value
About This Home
This home is located at 23 Salerno Ln, Houston, TX 77076 and is currently estimated at $420,489, approximately $182 per square foot. 23 Salerno Ln is a home located in Harris County with nearby schools including Lyons Elementary School, Fonville Middle School, and Sam Houston Math, Science & Technology Center.
Ownership History
Date
Name
Owned For
Owner Type
Purchase Details
Closed on
Jul 14, 2016
Sold by
Salerno John J and Salerno Sharon L
Bought by
Jones Barbie
Current Estimated Value
Home Financials for this Owner
Home Financials are based on the most recent Mortgage that was taken out on this home.
Original Mortgage
$282,000
Outstanding Balance
$224,221
Interest Rate
3.54%
Mortgage Type
New Conventional
Estimated Equity
$196,268
Create a Home Valuation Report for This Property
The Home Valuation Report is an in-depth analysis detailing your home's value as well as a comparison with similar homes in the area
Home Values in the Area
Average Home Value in this Area
Purchase History
| Date | Buyer | Sale Price | Title Company |
|---|---|---|---|
| Jones Barbie | -- | Stewart Title |
Source: Public Records
Mortgage History
| Date | Status | Borrower | Loan Amount |
|---|---|---|---|
| Open | Jones Barbie | $282,000 |
Source: Public Records
Tax History Compared to Growth
Tax History
| Year | Tax Paid | Tax Assessment Tax Assessment Total Assessment is a certain percentage of the fair market value that is determined by local assessors to be the total taxable value of land and additions on the property. | Land | Improvement |
|---|---|---|---|---|
| 2025 | $7,539 | $600,000 | $282,488 | $317,512 |
| 2024 | $7,539 | $518,731 | $141,244 | $377,487 |
| 2023 | $7,539 | $522,000 | $136,688 | $385,312 |
| 2022 | $9,124 | $450,000 | $106,313 | $343,687 |
| 2021 | $8,780 | $393,288 | $55,688 | $337,600 |
| 2020 | $8,293 | $366,811 | $55,688 | $311,123 |
| 2019 | $7,878 | $365,082 | $55,688 | $309,394 |
| 2018 | $5,456 | $283,019 | $40,500 | $242,519 |
| 2017 | $6,528 | $258,179 | $40,500 | $217,679 |
| 2016 | $5,431 | $214,780 | $40,500 | $174,280 |
| 2015 | $1,957 | $205,601 | $40,500 | $165,101 |
| 2014 | $1,957 | $205,601 | $40,500 | $165,101 |
Source: Public Records
Map
Nearby Homes
- 10202 Fulton St
- 10135 Fulton St
- 10210 Fulton St
- 10245 O Donnell Dr
- 10041 Fulton St
- 904 Ellena Rd Unit 16
- 59 E Sunnyside St
- 153 Treasure Dr
- 129 E Sunnyside St
- 9815 Fulton Park Ln
- 9910 Fulton St
- 9813 Fulton Park Ln
- 9905 Fulton St
- 7 Parker Rd Unit 12
- 64 Dipping Ln
- 9215 Plan at Fulton Crossing
- 9289 Plan at Fulton Crossing
- 9293 Plan at Fulton Crossing
- 9236 Plan at Fulton Crossing
- 40 Dipping Ln