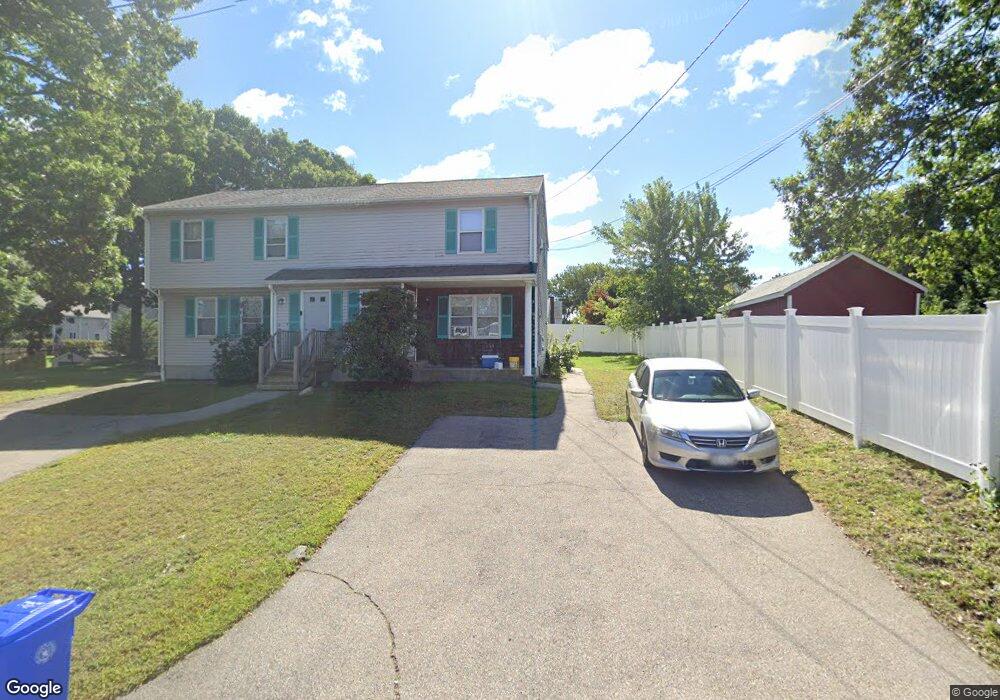
23 Scott St Unit 1 Attleboro, MA 02703
Estimated Value: $626,000 - $815,000
2
Beds
2
Baths
1,100
Sq Ft
$639/Sq Ft
Est. Value
About This Home
This home is located at 23 Scott St Unit 1, Attleboro, MA 02703 and is currently estimated at $702,519, approximately $638 per square foot. 23 Scott St Unit 1 is a home located in Bristol County with nearby schools including Hill-Roberts Elementary School, Robert J. Coelho Middle School, and Attleboro High School.
Ownership History
Date
Name
Owned For
Owner Type
Purchase Details
Closed on
Jun 22, 2021
Sold by
Kendall Tristen N
Bought by
Depina Ana
Current Estimated Value
Home Financials for this Owner
Home Financials are based on the most recent Mortgage that was taken out on this home.
Original Mortgage
$423,215
Outstanding Balance
$383,168
Interest Rate
2.9%
Mortgage Type
Purchase Money Mortgage
Estimated Equity
$319,351
Purchase Details
Closed on
Aug 23, 2011
Sold by
Fhlmc
Bought by
Kendall Tristen N
Create a Home Valuation Report for This Property
The Home Valuation Report is an in-depth analysis detailing your home's value as well as a comparison with similar homes in the area
Home Values in the Area
Average Home Value in this Area
Purchase History
| Date | Buyer | Sale Price | Title Company |
|---|---|---|---|
| Depina Ana | $497,900 | None Available | |
| Kendall Tristen N | $165,000 | -- |
Source: Public Records
Mortgage History
| Date | Status | Borrower | Loan Amount |
|---|---|---|---|
| Open | Depina Ana | $423,215 |
Source: Public Records
Tax History
| Year | Tax Paid | Tax Assessment Tax Assessment Total Assessment is a certain percentage of the fair market value that is determined by local assessors to be the total taxable value of land and additions on the property. | Land | Improvement |
|---|---|---|---|---|
| 2025 | $6,764 | $539,000 | $129,500 | $409,500 |
| 2024 | $7,041 | $553,100 | $129,500 | $423,600 |
| 2023 | $6,136 | $448,200 | $117,700 | $330,500 |
| 2022 | $6,214 | $430,000 | $112,100 | $317,900 |
| 2021 | $4,325 | $292,200 | $107,800 | $184,400 |
| 2020 | $4,185 | $287,400 | $104,700 | $182,700 |
| 2019 | $3,686 | $260,300 | $102,700 | $157,600 |
| 2018 | $4,163 | $246,300 | $99,700 | $146,600 |
| 2017 | $3,329 | $228,800 | $99,700 | $129,100 |
| 2016 | $3,361 | $226,800 | $97,900 | $128,900 |
| 2015 | $3,010 | $204,600 | $97,900 | $106,700 |
| 2014 | $3,328 | $224,100 | $93,200 | $130,900 |
Source: Public Records
Map
Nearby Homes
- 79 Turner St
- 37 Turner St
- 61 Mendon Rd
- 386 Mendon Ave
- 18 Newton St
- 50 Pullman Ave Unit A
- 50 Pullman Ave Unit B
- 56 Baltic St Unit 56
- 54 Baltic St Unit 54
- 52 Baltic St Unit 52
- 91 Greenwich St
- 179 Columbine Ave
- 735 Broadway
- 27 Collins Ave
- 215 Kenyon Ave
- 241 Mendon Rd
- 362 Kenyon Ave
- 39 Webster St Unit 204
- 25 Lord St
- 11 Appleton Ave
Your Personal Tour Guide
Ask me questions while you tour the home.