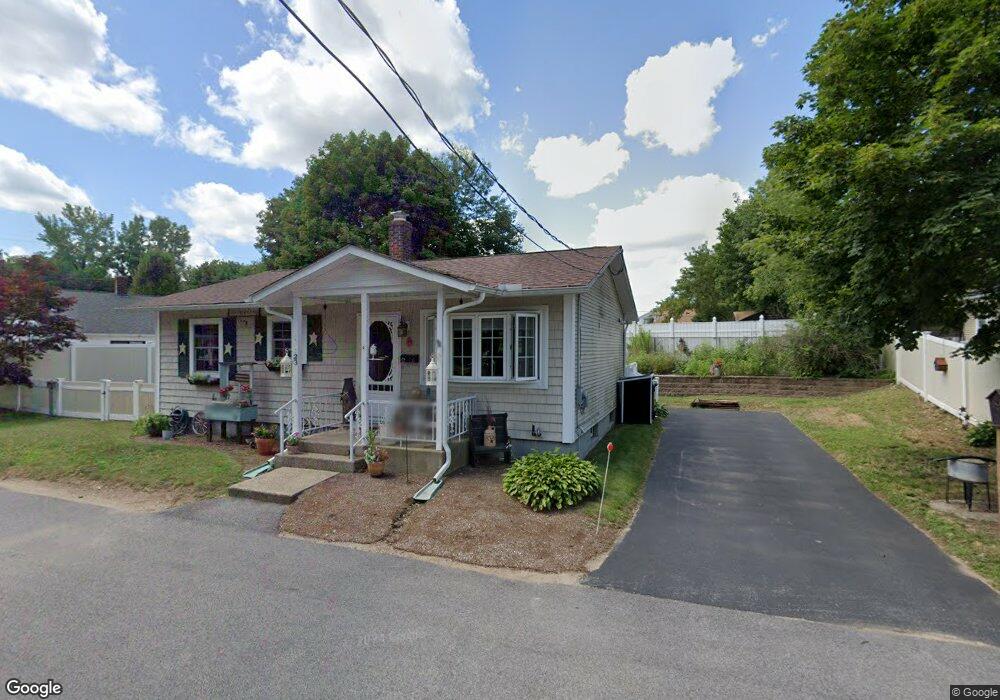
23 Seabury St Woonsocket, RI 02895
Globe District NeighborhoodEstimated Value: $306,700 - $383,000
3
Beds
1
Bath
816
Sq Ft
$405/Sq Ft
Est. Value
About This Home
This home is located at 23 Seabury St, Woonsocket, RI 02895 and is currently estimated at $330,425, approximately $404 per square foot. 23 Seabury St is a home located in Providence County with nearby schools including Woonsocket High School, Founders Academy, and Beacon Charter School.
Ownership History
Date
Name
Owned For
Owner Type
Purchase Details
Closed on
Jun 17, 2021
Sold by
Masterson Elaine L
Bought by
Elaine L Masterson T L and Elaine Masterson
Current Estimated Value
Purchase Details
Closed on
Mar 15, 1996
Sold by
Dalton Muriel C
Bought by
Masterson Robert H and Mayer Elaine L
Create a Home Valuation Report for This Property
The Home Valuation Report is an in-depth analysis detailing your home's value as well as a comparison with similar homes in the area
Home Values in the Area
Average Home Value in this Area
Purchase History
| Date | Buyer | Sale Price | Title Company |
|---|---|---|---|
| Elaine L Masterson T L | -- | None Available | |
| Elaine L Masterson T | -- | None Available | |
| Elaine L Masterson T L | -- | None Available | |
| Masterson Robert H | $75,000 | -- | |
| Masterson Robert H | $75,000 | -- |
Source: Public Records
Mortgage History
| Date | Status | Borrower | Loan Amount |
|---|---|---|---|
| Previous Owner | Masterson Robert H | $148,000 | |
| Previous Owner | Masterson Robert H | $22,000 |
Source: Public Records
Tax History
| Year | Tax Paid | Tax Assessment Tax Assessment Total Assessment is a certain percentage of the fair market value that is determined by local assessors to be the total taxable value of land and additions on the property. | Land | Improvement |
|---|---|---|---|---|
| 2025 | $3,363 | $299,500 | $96,200 | $203,300 |
| 2024 | $2,971 | $204,300 | $91,400 | $112,900 |
| 2023 | $2,856 | $204,300 | $91,400 | $112,900 |
| 2022 | $2,856 | $204,300 | $91,400 | $112,900 |
| 2021 | $2,928 | $123,300 | $59,000 | $64,300 |
| 2020 | $2,959 | $123,300 | $59,000 | $64,300 |
| 2018 | $2,969 | $123,300 | $59,000 | $64,300 |
| 2017 | $3,299 | $109,600 | $53,700 | $55,900 |
| 2016 | $3,490 | $109,600 | $53,700 | $55,900 |
| 2015 | $4,009 | $109,600 | $53,700 | $55,900 |
| 2014 | $3,997 | $111,200 | $59,100 | $52,100 |
Source: Public Records
Map
Nearby Homes
- 604 Providence St
- 1 Admiral St
- 184 Avenue C Unit 2
- 184 Avenue C Unit 5
- 184 Avenue C Unit 6
- 184 Avenue C Unit 3
- 184 Avenue C Unit 4
- 184 Avenue C Unit 1
- 43 Summit St
- 25 Ormond St
- 1060 Park Ave
- 80 Summit St
- 190 Coe St
- 109 Hemond Ave
- 147 Warwick St
- 84 Bernice Ave
- 435 S Main St
- 0 Laflamme Ave
- 0 Chester St
- 122 Grand St
Your Personal Tour Guide
Ask me questions while you tour the home.