Estimated Value: $375,000 - $462,000
--
Bed
--
Bath
2,756
Sq Ft
$150/Sq Ft
Est. Value
About This Home
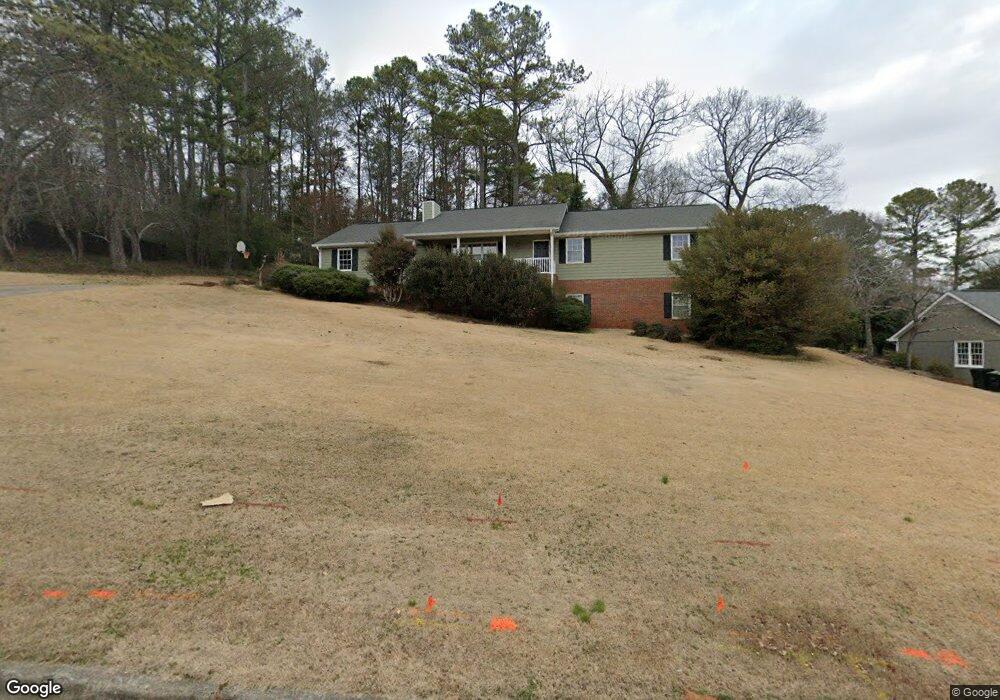
This home is located at 23 Shadowood Dr SE, Rome, GA 30161 and is currently estimated at $413,753, approximately $150 per square foot. 23 Shadowood Dr SE is a home located in Floyd County with nearby schools including Rome High School, St. Mary School, and Unity Christian School.
Ownership History
Date
Name
Owned For
Owner Type
Purchase Details
Closed on
Nov 20, 2009
Sold by
Ozment Jeffrey L
Bought by
Swanagan Brian
Current Estimated Value
Home Financials for this Owner
Home Financials are based on the most recent Mortgage that was taken out on this home.
Original Mortgage
$161,500
Outstanding Balance
$105,021
Interest Rate
4.92%
Mortgage Type
New Conventional
Estimated Equity
$308,732
Purchase Details
Closed on
May 12, 2003
Sold by
Howard Pamela W
Bought by
Ozment Jeffrey L and Ozment Sandra T
Purchase Details
Closed on
Aug 2, 2000
Sold by
Howard Ricky and Howard Pamela W
Bought by
Howard Pamela W
Purchase Details
Closed on
Nov 27, 1987
Sold by
Ward Houston C & Nancy M
Bought by
Howard Ricky and Howard Pamela W
Purchase Details
Closed on
Jan 31, 1979
Sold by
Harrington James H
Bought by
Ward Houston C & Nancy M
Purchase Details
Closed on
May 30, 1978
Sold by
Prestige Parks Inc
Bought by
Harrington James H
Purchase Details
Closed on
Oct 31, 1975
Bought by
Prestige Parks Inc
Create a Home Valuation Report for This Property
The Home Valuation Report is an in-depth analysis detailing your home's value as well as a comparison with similar homes in the area
Home Values in the Area
Average Home Value in this Area
Purchase History
| Date | Buyer | Sale Price | Title Company |
|---|---|---|---|
| Swanagan Brian | $170,000 | -- | |
| Swanagan Brian | $170,000 | -- | |
| Ozment Jeffrey L | $180,000 | -- | |
| Howard Pamela W | -- | -- | |
| Howard Ricky | $98,000 | -- | |
| Ward Houston C & Nancy M | $71,000 | -- | |
| Harrington James H | $8,000 | -- | |
| Prestige Parks Inc | -- | -- |
Source: Public Records
Mortgage History
| Date | Status | Borrower | Loan Amount |
|---|---|---|---|
| Open | Swanagan Brian | $161,500 | |
| Closed | Swanagan Brian | $161,500 |
Source: Public Records
Tax History Compared to Growth
Tax History
| Year | Tax Paid | Tax Assessment Tax Assessment Total Assessment is a certain percentage of the fair market value that is determined by local assessors to be the total taxable value of land and additions on the property. | Land | Improvement |
|---|---|---|---|---|
| 2024 | $4,811 | $126,214 | $11,986 | $114,228 |
| 2023 | $4,470 | $127,244 | $10,654 | $116,590 |
| 2022 | $3,904 | $106,987 | $8,656 | $98,331 |
| 2021 | $3,047 | $82,112 | $8,656 | $73,456 |
| 2020 | $2,883 | $77,052 | $6,658 | $70,394 |
| 2019 | $2,733 | $73,846 | $6,658 | $67,188 |
| 2018 | $2,610 | $70,497 | $6,658 | $63,839 |
| 2017 | $2,464 | $66,542 | $6,658 | $59,884 |
| 2016 | $2,441 | $65,720 | $6,640 | $59,080 |
| 2015 | $2,491 | $66,640 | $6,640 | $60,000 |
| 2014 | $2,491 | $65,600 | $6,640 | $58,960 |
Source: Public Records
Map
Nearby Homes
- 20 Mitchell Cir SE
- 9 Heather Rd SE
- 100 Valley Brook Dr SE
- 4 Mitchell Cir SE
- 120 Keown Rd SE
- 14 Laurchris Dr SE
- 6 Woodland Dr SE
- 0 Lakeshore Dr
- 26 Maplewood Square SE
- 227 W Lakeshore Dr SE
- 22 Oakfield Dr SE
- 0 Georgia 293
- 11 Breckenridge Rd SE
- 13 Breckenridge Rd SE
- 226 Maplecrest Ln SE
- 22 Robin Hood Rd NE
- 11 Surrey Trail SE
- 36 Busby Dr SE
- 38 Busby Dr SE
- 21 Shadowood Dr SE
- 25 Shadowood Dr SE
- 20 Shadowood Dr SE
- 22 Shadowood Dr SE
- 133 Keown Rd SE
- 0 Shadowood Dr NE Unit 3025392
- 0 Shadowood Dr NE
- 18 Shadowood Dr SE
- 19 Shadowood Dr SE
- 0 Shadowood Dr SE Unit 20015739
- 0 Shadowood Dr SE Unit 7329128
- 0 Shadowood Dr SE Unit 7272122
- 0 Shadowood Dr SE Unit 8658036
- 0 Shadowood Dr SE Unit 8460418
- 0 Shadowood Dr SE Unit 8042692
- 0 Shadowood Dr SE Unit 7542288
- 0 Shadowood Dr SE Unit 8386307
- 0 Shadowood Dr SE Unit 7119199
- 0 Shadowood Dr SE
- 27 Shadowood Dr SE