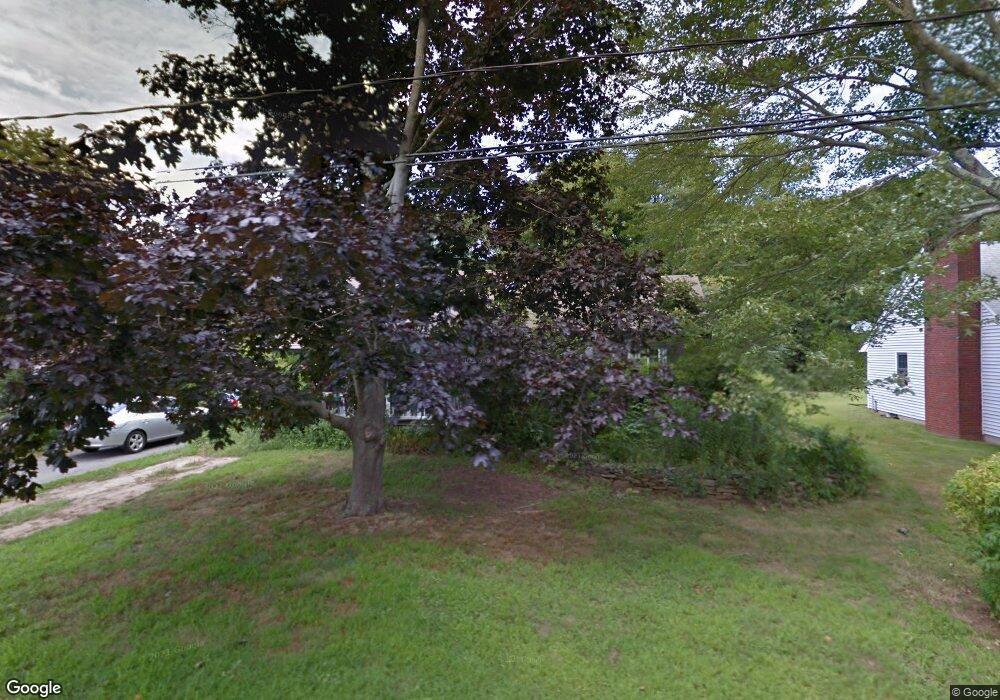
23 Shepard St Old Saybrook, CT 06475
Estimated Value: $534,784 - $694,000
2
Beds
1
Bath
1,382
Sq Ft
$438/Sq Ft
Est. Value
About This Home
This home is located at 23 Shepard St, Old Saybrook, CT 06475 and is currently estimated at $605,196, approximately $437 per square foot. 23 Shepard St is a home located in Middlesex County with nearby schools including Kathleen E. Goodwin School, Old Saybrook Middle School, and Old Saybrook Senior High School.
Ownership History
Date
Name
Owned For
Owner Type
Purchase Details
Closed on
Nov 5, 2021
Sold by
Flammang Paul J and Flammang Megan M
Bought by
Flammang Joseph
Current Estimated Value
Home Financials for this Owner
Home Financials are based on the most recent Mortgage that was taken out on this home.
Original Mortgage
$160,000
Outstanding Balance
$146,734
Interest Rate
3.05%
Mortgage Type
Stand Alone Refi Refinance Of Original Loan
Estimated Equity
$458,462
Purchase Details
Closed on
Jun 4, 2018
Sold by
Flammang Paul J
Bought by
Flammang Joseph
Purchase Details
Closed on
Aug 5, 1986
Bought by
Flammang Paul J and Flammang Megan M
Create a Home Valuation Report for This Property
The Home Valuation Report is an in-depth analysis detailing your home's value as well as a comparison with similar homes in the area
Home Values in the Area
Average Home Value in this Area
Purchase History
| Date | Buyer | Sale Price | Title Company |
|---|---|---|---|
| Flammang Joseph | -- | None Available | |
| Flammang Joseph | -- | None Available | |
| Flammang Joseph | -- | -- | |
| Flammang Paul J | -- | -- | |
| Flammang Joseph | -- | -- |
Source: Public Records
Mortgage History
| Date | Status | Borrower | Loan Amount |
|---|---|---|---|
| Open | Flammang Joseph | $160,000 | |
| Closed | Flammang Joseph | $160,000 | |
| Previous Owner | Flammang Paul J | $60,000 | |
| Previous Owner | Flammang Paul J | $196,000 | |
| Previous Owner | Flammang Paul J | $40,000 |
Source: Public Records
Tax History
| Year | Tax Paid | Tax Assessment Tax Assessment Total Assessment is a certain percentage of the fair market value that is determined by local assessors to be the total taxable value of land and additions on the property. | Land | Improvement |
|---|---|---|---|---|
| 2025 | $4,224 | $272,500 | $114,900 | $157,600 |
| 2024 | $4,142 | $272,500 | $114,900 | $157,600 |
| 2023 | $3,980 | $194,600 | $90,700 | $103,900 |
| 2022 | $3,908 | $194,600 | $90,700 | $103,900 |
| 2021 | $3,902 | $194,600 | $90,700 | $103,900 |
| 2020 | $3,902 | $194,600 | $90,700 | $103,900 |
| 2019 | $3,843 | $194,600 | $90,700 | $103,900 |
| 2018 | $4,151 | $211,800 | $90,700 | $121,100 |
| 2017 | $4,164 | $211,800 | $90,700 | $121,100 |
| 2016 | $4,079 | $211,800 | $90,700 | $121,100 |
| 2015 | $3,984 | $211,800 | $90,700 | $121,100 |
| 2014 | $3,918 | $211,800 | $90,700 | $121,100 |
Source: Public Records
Map
Nearby Homes
- 367 Main St Unit 7
- 18 Quarry St
- 11 S View Terrace
- 125 Main St
- 1333A Boston Post Rd
- 25 Pond Rd
- 25 Sunset Rd Unit 7
- 13 College St
- 60 Ingham Hill Rd
- 24 Church St
- 104 Knollwood Dr
- 105 Fenwood Dr
- 10 Mulberry St
- 1 Beamon Meadow Place
- 73 Knollwood Dr
- 39 Middletown Ave
- 10 Edwards Rd
- 21 Fenwick St
- 122 Old Post Rd
- 0 Middlesex Turnpike
Your Personal Tour Guide
Ask me questions while you tour the home.