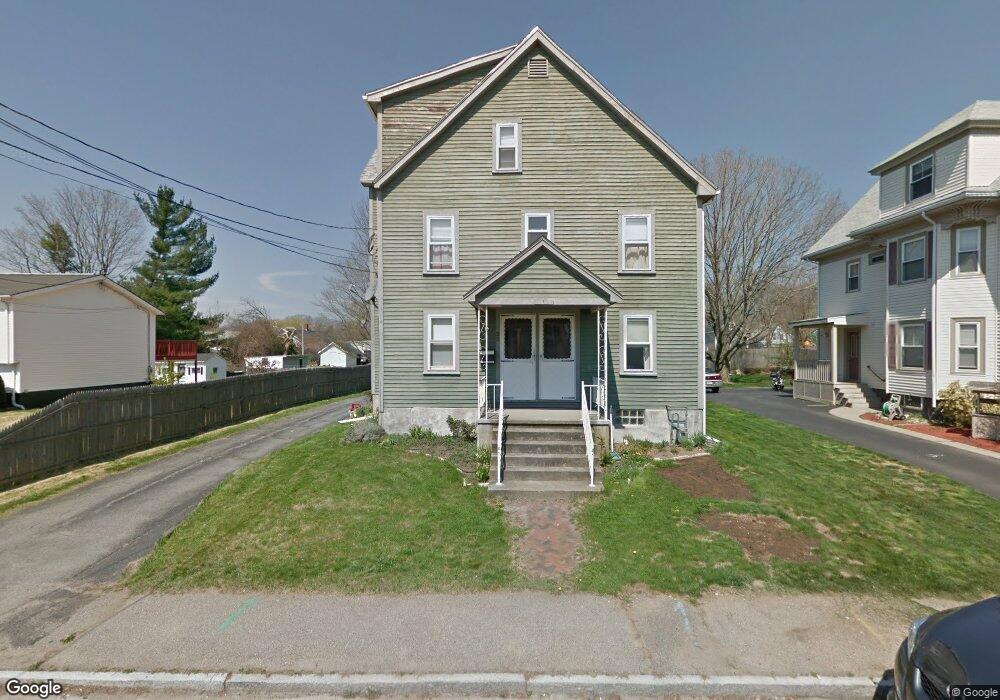
23 Sheridan St Taunton, MA 02780
Estimated Value: $706,000 - $749,000
7
Beds
4
Baths
3,298
Sq Ft
$221/Sq Ft
Est. Value
About This Home
This home is located at 23 Sheridan St, Taunton, MA 02780 and is currently estimated at $729,333, approximately $221 per square foot. 23 Sheridan St is a home located in Bristol County with nearby schools including H. H. Galligan School, Benjamin Friedman Middle School, and Taunton High School.
Ownership History
Date
Name
Owned For
Owner Type
Purchase Details
Closed on
Dec 1, 2009
Sold by
Lavoie Ft
Bought by
Lavoie Jr Tr Richard and Cody Michael T
Current Estimated Value
Create a Home Valuation Report for This Property
The Home Valuation Report is an in-depth analysis detailing your home's value as well as a comparison with similar homes in the area
Home Values in the Area
Average Home Value in this Area
Purchase History
| Date | Buyer | Sale Price | Title Company |
|---|---|---|---|
| Lavoie Jr Tr Richard | -- | -- |
Source: Public Records
Tax History Compared to Growth
Tax History
| Year | Tax Paid | Tax Assessment Tax Assessment Total Assessment is a certain percentage of the fair market value that is determined by local assessors to be the total taxable value of land and additions on the property. | Land | Improvement |
|---|---|---|---|---|
| 2025 | $6,947 | $635,000 | $93,800 | $541,200 |
| 2024 | $6,621 | $591,700 | $93,800 | $497,900 |
| 2023 | $6,261 | $519,600 | $93,800 | $425,800 |
| 2022 | $5,851 | $443,900 | $78,100 | $365,800 |
| 2021 | $5,008 | $352,700 | $71,000 | $281,700 |
| 2020 | $4,884 | $328,700 | $71,000 | $257,700 |
| 2019 | $4,536 | $287,800 | $71,000 | $216,800 |
| 2018 | $4,145 | $263,700 | $70,600 | $193,100 |
| 2017 | $3,709 | $236,100 | $67,000 | $169,100 |
| 2016 | $3,483 | $222,100 | $65,000 | $157,100 |
| 2015 | $3,311 | $220,600 | $66,000 | $154,600 |
| 2014 | $3,173 | $217,200 | $62,600 | $154,600 |
Source: Public Records
Map
Nearby Homes