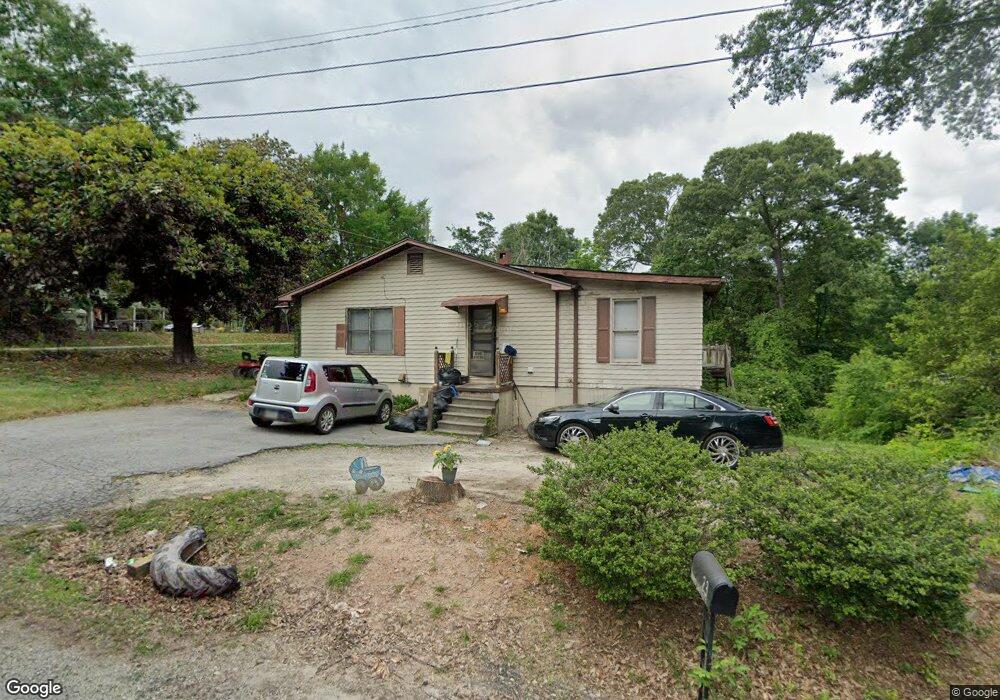
23 Sherri Ln Toccoa, GA 30577
Estimated Value: $123,000 - $266,000
2
Beds
1
Bath
1,312
Sq Ft
$131/Sq Ft
Est. Value
About This Home
This home is located at 23 Sherri Ln, Toccoa, GA 30577 and is currently estimated at $172,418, approximately $131 per square foot. 23 Sherri Ln is a home located in Stephens County with nearby schools including Stephens County High School.
Ownership History
Date
Name
Owned For
Owner Type
Purchase Details
Closed on
Apr 12, 2024
Sold by
Lee Scott
Bought by
Foster Joshua E and Powell Jerry Lee
Current Estimated Value
Purchase Details
Closed on
Sep 29, 2006
Sold by
Couture Annette
Bought by
Scott Lee
Home Financials for this Owner
Home Financials are based on the most recent Mortgage that was taken out on this home.
Original Mortgage
$44,800
Interest Rate
6.36%
Mortgage Type
New Conventional
Purchase Details
Closed on
Nov 24, 1997
Sold by
Polly Jackie Dean and Janet Lee
Bought by
Couture Annette M
Purchase Details
Closed on
Sep 6, 1985
Sold by
Carswell Joe D and Carswell Nancy P
Bought by
Polly Jackie Dean and Janet Lee
Purchase Details
Closed on
Apr 10, 1978
Sold by
Fowler Arthur S and Fowler Joyce B
Bought by
Carswell Joe D and Carswell Nancy P
Purchase Details
Closed on
Jan 30, 1973
Sold by
Lecroy Jewell and Jimmie Sue
Bought by
Fowler Arthur S and Fowler Joyce B
Purchase Details
Closed on
Apr 24, 1962
Sold by
Hunt W H
Bought by
Lecroy Jewell and Jimmie Sue
Create a Home Valuation Report for This Property
The Home Valuation Report is an in-depth analysis detailing your home's value as well as a comparison with similar homes in the area
Home Values in the Area
Average Home Value in this Area
Purchase History
| Date | Buyer | Sale Price | Title Company |
|---|---|---|---|
| Foster Joshua E | $10,000 | -- | |
| Scott Lee | $52,500 | -- | |
| Scott Lee | $52,500 | -- | |
| Couture Annette M | $46,000 | -- | |
| Polly Jackie Dean | $32,600 | -- | |
| Carswell Joe D | $18,900 | -- | |
| Fowler Arthur S | $12,200 | -- | |
| Lecroy Jewell | -- | -- |
Source: Public Records
Mortgage History
| Date | Status | Borrower | Loan Amount |
|---|---|---|---|
| Previous Owner | Scott Lee | $44,800 |
Source: Public Records
Tax History Compared to Growth
Tax History
| Year | Tax Paid | Tax Assessment Tax Assessment Total Assessment is a certain percentage of the fair market value that is determined by local assessors to be the total taxable value of land and additions on the property. | Land | Improvement |
|---|---|---|---|---|
| 2024 | $807 | $26,518 | $1,572 | $24,946 |
| 2023 | $748 | $24,578 | $1,572 | $23,006 |
| 2022 | $666 | $22,362 | $1,572 | $20,790 |
| 2021 | $645 | $20,615 | $1,572 | $19,043 |
| 2020 | $649 | $20,538 | $1,572 | $18,966 |
| 2019 | $651 | $20,538 | $1,572 | $18,966 |
| 2018 | $651 | $20,538 | $1,572 | $18,966 |
| 2017 | $662 | $20,538 | $1,572 | $18,966 |
| 2016 | $651 | $20,537 | $1,571 | $18,966 |
| 2015 | $679 | $20,434 | $1,571 | $18,862 |
| 2014 | $690 | $20,434 | $1,572 | $18,863 |
| 2013 | -- | $20,651 | $1,571 | $19,080 |
Source: Public Records
Map
Nearby Homes