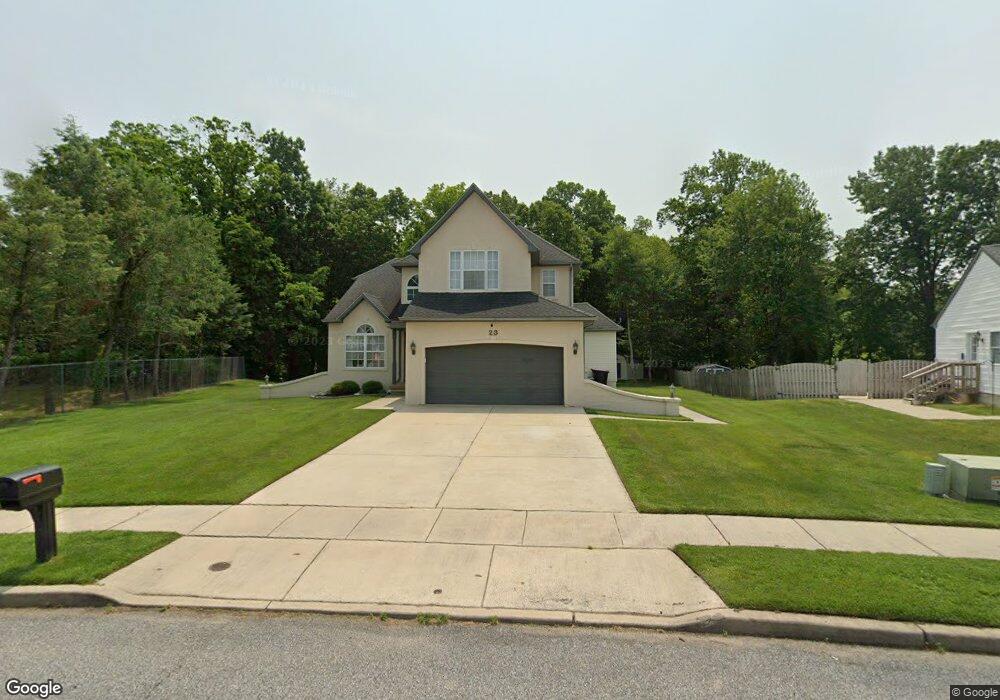
23 Sinatra Dr Sicklerville, NJ 08081
Erial NeighborhoodEstimated Value: $422,637 - $455,000
Studio
--
Bath
2,051
Sq Ft
$215/Sq Ft
Est. Value
About This Home
This home is located at 23 Sinatra Dr, Sicklerville, NJ 08081 and is currently estimated at $440,159, approximately $214 per square foot. 23 Sinatra Dr is a home located in Camden County with nearby schools including James W. Lilley Elementary School, Ann A Mullen Middle School, and Timber Creek High School.
Ownership History
Date
Name
Owned For
Owner Type
Purchase Details
Closed on
Sep 15, 2008
Sold by
Deangelo Joseph A
Bought by
Deangelo Joseph A and Deangelo Jolanda J
Current Estimated Value
Purchase Details
Closed on
Jan 3, 1995
Sold by
Defeo Spring Valley Dev Corp
Bought by
Deangelo Joseph A
Home Financials for this Owner
Home Financials are based on the most recent Mortgage that was taken out on this home.
Original Mortgage
$132,000
Interest Rate
7.16%
Mortgage Type
VA
Create a Home Valuation Report for This Property
The Home Valuation Report is an in-depth analysis detailing your home's value as well as a comparison with similar homes in the area
Home Values in the Area
Average Home Value in this Area
Purchase History
| Date | Buyer | Sale Price | Title Company |
|---|---|---|---|
| Deangelo Joseph A | -- | -- | |
| Deangelo Joseph A | $129,900 | -- |
Source: Public Records
Mortgage History
| Date | Status | Borrower | Loan Amount |
|---|---|---|---|
| Previous Owner | Deangelo Joseph A | $132,000 |
Source: Public Records
Tax History
| Year | Tax Paid | Tax Assessment Tax Assessment Total Assessment is a certain percentage of the fair market value that is determined by local assessors to be the total taxable value of land and additions on the property. | Land | Improvement |
|---|---|---|---|---|
| 2025 | $10,149 | $233,900 | $67,800 | $166,100 |
| 2024 | $9,861 | $233,900 | $67,800 | $166,100 |
| 2023 | $9,861 | $233,900 | $67,800 | $166,100 |
| 2022 | $9,805 | $233,900 | $67,800 | $166,100 |
| 2021 | $8,704 | $233,900 | $67,800 | $166,100 |
| 2020 | $9,604 | $233,900 | $67,800 | $166,100 |
| 2019 | $9,396 | $233,900 | $67,800 | $166,100 |
| 2018 | $9,356 | $233,900 | $67,800 | $166,100 |
| 2017 | $9,057 | $233,900 | $67,800 | $166,100 |
| 2016 | $9,587 | $253,300 | $67,800 | $185,500 |
| 2015 | $8,646 | $253,300 | $67,800 | $185,500 |
| 2014 | $8,616 | $253,300 | $67,800 | $185,500 |
Source: Public Records
Map
Nearby Homes
- 34 Vance Ave
- 3 Balsley Ct
- 61 Berkshire Rd
- 155 Hampshire Rd
- 135 Hampshire Rd
- 69 Edinshire Rd
- 43 Ashland Ave
- 105 Berkshire Rd
- 31 Brookshire Rd
- 36 Edinshire Rd
- 41 Barnes Way
- Fairfield Plan at Emerson Square
- 12 Handbell Ln
- Richmond Plan at Emerson Square
- 110 Old School House Rd
- 9 Ashland Ave
- Chase Grande Plan at Chase Pointe
- 2 Jerrys Ct
- 75 Morgan's Mill Rd
- 102 Old School House Rd
- 21 Sinatra Dr
- 19 Sinatra Dr
- 16 Sinatra Dr
- 20 Sinatra Dr
- 17 Sinatra Dr
- 14 Sinatra Dr
- 10 Brookstone Dr
- 8 Brookstone Dr
- 15 Sinatra Dr
- 12 Sinatra Dr
- 32 Vance Ave
- 12 Brookstone Dr
- 42 E Meadowbrook Cir
- 13 Sinatra Dr
- 38 Vance Ave
- 44 E Meadowbrook Cir
- 10 Sinatra Dr
- 30 Vance Ave
- 40 E Meadowbrook Cir
- 14 Brookstone Dr
Your Personal Tour Guide
Ask me questions while you tour the home.