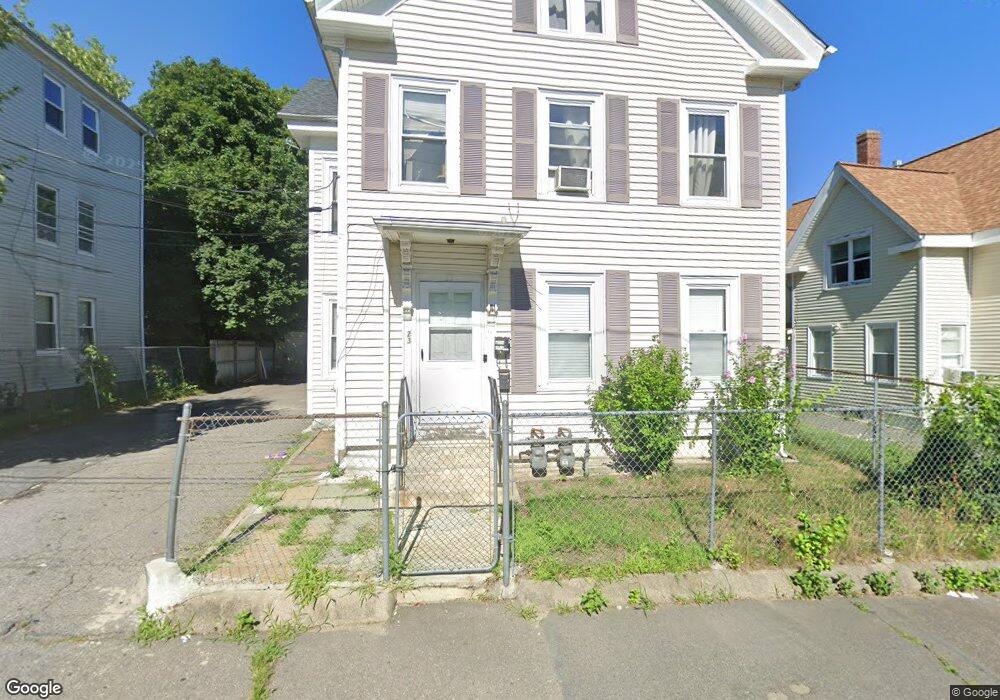
23 Skinner St Brockton, MA 02302
Clifton Heights NeighborhoodEstimated Value: $630,238 - $749,000
6
Beds
3
Baths
2,184
Sq Ft
$319/Sq Ft
Est. Value
About This Home
This home is located at 23 Skinner St, Brockton, MA 02302 and is currently estimated at $696,310, approximately $318 per square foot. 23 Skinner St is a home located in Plymouth County with nearby schools including Arnone Elementary School, Joseph F. Plouffe Middle School, and Trinity Catholic Academy.
Ownership History
Date
Name
Owned For
Owner Type
Purchase Details
Closed on
Oct 18, 2010
Sold by
Deal Structurer Com In
Bought by
Yerardi Francis M and Baystate Prop Re Llc
Current Estimated Value
Home Financials for this Owner
Home Financials are based on the most recent Mortgage that was taken out on this home.
Original Mortgage
$130,000
Outstanding Balance
$85,830
Interest Rate
4.36%
Mortgage Type
Purchase Money Mortgage
Estimated Equity
$610,480
Purchase Details
Closed on
Jun 12, 2009
Sold by
Cedeno Theophilus and Cedeno Preditta
Bought by
Deal Structurercom Inc
Purchase Details
Closed on
Jun 9, 2004
Sold by
Pires Gabriel F
Bought by
Cedeno Theophilus and Cedeno Preditta
Purchase Details
Closed on
May 3, 1999
Sold by
Fhlmc
Bought by
Pires Gabriel F
Purchase Details
Closed on
Mar 12, 1998
Sold by
Morson Michael L and Morson Fhlmc
Bought by
Fhlmc
Create a Home Valuation Report for This Property
The Home Valuation Report is an in-depth analysis detailing your home's value as well as a comparison with similar homes in the area
Home Values in the Area
Average Home Value in this Area
Purchase History
| Date | Buyer | Sale Price | Title Company |
|---|---|---|---|
| Yerardi Francis M | $150,000 | -- | |
| Deal Structurercom Inc | $150,000 | -- | |
| Cedeno Theophilus | $335,000 | -- | |
| Pires Gabriel F | $83,500 | -- | |
| Fhlmc | $103,615 | -- |
Source: Public Records
Mortgage History
| Date | Status | Borrower | Loan Amount |
|---|---|---|---|
| Open | Yerardi Francis M | $130,000 | |
| Closed | Fhlmc | $25,000 | |
| Previous Owner | Fhlmc | $150,000 |
Source: Public Records
Tax History Compared to Growth
Tax History
| Year | Tax Paid | Tax Assessment Tax Assessment Total Assessment is a certain percentage of the fair market value that is determined by local assessors to be the total taxable value of land and additions on the property. | Land | Improvement |
|---|---|---|---|---|
| 2025 | $6,839 | $564,700 | $136,400 | $428,300 |
| 2024 | $6,597 | $548,800 | $136,400 | $412,400 |
| 2023 | $5,655 | $435,700 | $102,100 | $333,600 |
| 2022 | $5,908 | $422,900 | $92,600 | $330,300 |
| 2021 | $5,065 | $349,300 | $76,600 | $272,700 |
| 2020 | $4,992 | $329,500 | $72,200 | $257,300 |
| 2019 | $5,119 | $329,400 | $69,800 | $259,600 |
| 2018 | $4,563 | $284,100 | $69,800 | $214,300 |
| 2017 | $4,381 | $272,100 | $69,800 | $202,300 |
| 2016 | $3,821 | $220,100 | $67,600 | $152,500 |
| 2015 | $3,563 | $196,300 | $67,600 | $128,700 |
| 2014 | $3,419 | $188,600 | $67,600 | $121,000 |
Source: Public Records
Map
Nearby Homes