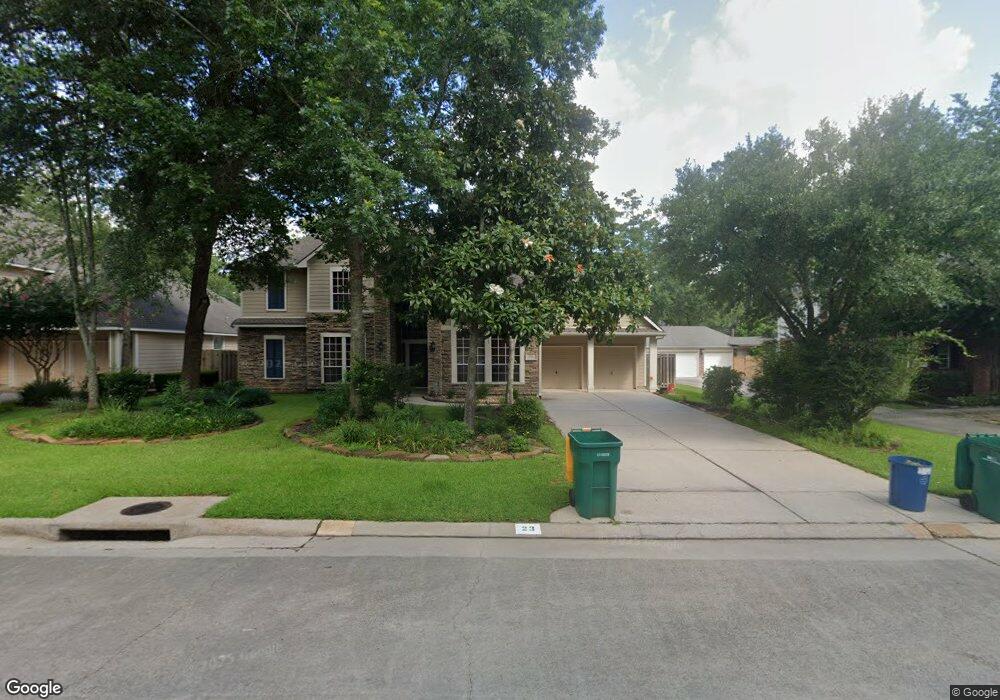
23 Slatestone Cir Spring, TX 77382
Alden Bridge NeighborhoodEstimated Value: $835,000 - $916,000
5
Beds
5
Baths
3,782
Sq Ft
$233/Sq Ft
Est. Value
About This Home
This home is located at 23 Slatestone Cir, Spring, TX 77382 and is currently estimated at $880,750, approximately $232 per square foot. 23 Slatestone Cir is a home located in Montgomery County with nearby schools including Buckalew Elementary School, Mitchell Intermediate School, and McCullough Junior High School.
Ownership History
Date
Name
Owned For
Owner Type
Purchase Details
Closed on
Feb 14, 2025
Sold by
Dunn David and Dunn Kristin
Bought by
Dunn Kyle
Current Estimated Value
Purchase Details
Closed on
Sep 17, 2009
Sold by
Khamisa Minaz and Khamisa Melanie Louise Brooks
Bought by
Dunn David and Dunn Kristin
Home Financials for this Owner
Home Financials are based on the most recent Mortgage that was taken out on this home.
Original Mortgage
$300,000
Interest Rate
5.2%
Mortgage Type
New Conventional
Purchase Details
Closed on
Jun 27, 2000
Sold by
Weekley Homes Lp
Bought by
Khamisa Minaz
Home Financials for this Owner
Home Financials are based on the most recent Mortgage that was taken out on this home.
Original Mortgage
$252,700
Interest Rate
8.66%
Purchase Details
Closed on
Nov 23, 1999
Sold by
Woodlands Land Development Lp
Bought by
Dunn David and Dunn Kristin
Create a Home Valuation Report for This Property
The Home Valuation Report is an in-depth analysis detailing your home's value as well as a comparison with similar homes in the area
Home Values in the Area
Average Home Value in this Area
Purchase History
| Date | Buyer | Sale Price | Title Company |
|---|---|---|---|
| Dunn Kyle | -- | None Listed On Document | |
| Dunn David | -- | Stewart Title Of Montgomery | |
| Khamisa Minaz | -- | Priority Title | |
| Dunn David | -- | -- |
Source: Public Records
Mortgage History
| Date | Status | Borrower | Loan Amount |
|---|---|---|---|
| Previous Owner | Dunn David | $300,000 | |
| Previous Owner | Khamisa Minaz | $252,700 |
Source: Public Records
Tax History Compared to Growth
Tax History
| Year | Tax Paid | Tax Assessment Tax Assessment Total Assessment is a certain percentage of the fair market value that is determined by local assessors to be the total taxable value of land and additions on the property. | Land | Improvement |
|---|---|---|---|---|
| 2025 | $8,940 | $748,687 | -- | -- |
| 2024 | $8,940 | $680,625 | -- | -- |
| 2023 | $9,579 | $618,750 | $100,000 | $629,000 |
| 2022 | $11,401 | $562,500 | $100,000 | $559,000 |
| 2021 | $11,154 | $511,360 | $50,200 | $461,160 |
| 2020 | $11,844 | $512,000 | $50,200 | $461,800 |
| 2019 | $11,934 | $500,000 | $50,200 | $449,800 |
| 2018 | $11,086 | $511,190 | $50,200 | $460,990 |
| 2017 | $12,350 | $511,190 | $50,200 | $460,990 |
| 2016 | $12,762 | $528,240 | $50,200 | $479,290 |
| 2015 | $10,421 | $480,220 | $50,200 | $479,290 |
| 2014 | $10,421 | $436,560 | $50,200 | $439,670 |
Source: Public Records
Map
Nearby Homes
- 35 Dewdrift Place
- 3 Broadweather Place
- 170 Linton Downs Place
- 66 N Brooksedge Cir
- 15 Redland Place
- 11 Lyreleaf Place
- 19 Almond Branch Place
- 22 Almond Branch Place
- 183 Shale Run Place
- 19 E Sundance Cir
- 70 Harvest Wind Place
- 22 Royal Ridge Place
- 413 New Forest Ln
- 78 N Walden Elms Cir
- 2 Argonne Place
- 234 Silver Dapple
- 81 N Apple Springs Cir
- 88 W Grand Regency Cir
- 35 N Walden Elms Cir
- 26 N Walden Elms Cir
- 19 Slatestone Cir
- 27 Slatestone Cir
- 6 Clingstone Place
- 10 Clingstone Place
- 31 Slatestone Cir
- 34 Rillwood Place
- 31 Rillwood Place
- 170 W Slatestone Cir
- 166 W Slatestone Cir
- 14 Clingstone Place
- 174 W Slatestone Cir
- 30 Rillwood Place
- 30 Slatestone Cir
- 18 Clingstone Place
- 27 Rillwood Place
- 162 W Slatestone Cir
- 26 Rillwood Place
- 158 W Slatestone Cir
- 38 Slatestone Cir
- 22 Clingstone Place