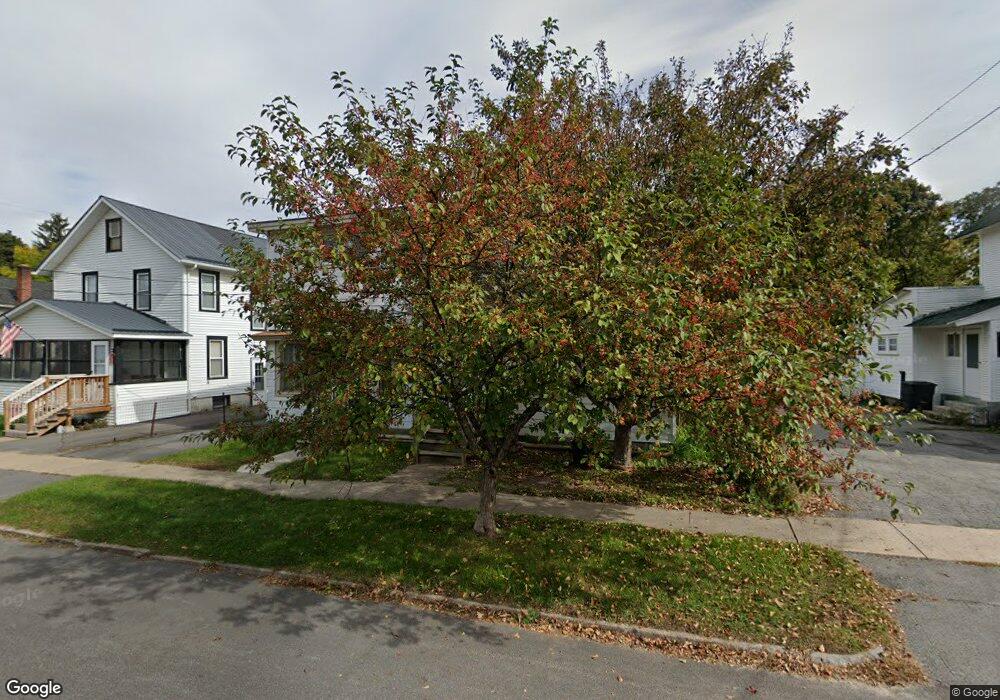
23 Smith St Plattsburgh, NY 12901
Estimated Value: $165,000 - $325,910
3
Beds
2
Baths
1,998
Sq Ft
$114/Sq Ft
Est. Value
About This Home
This home is located at 23 Smith St, Plattsburgh, NY 12901 and is currently estimated at $228,478, approximately $114 per square foot. 23 Smith St is a home located in Clinton County with nearby schools including Arthur P. Momot Elementary School, Stafford Middle School, and Plattsburgh Senior High School.
Ownership History
Date
Name
Owned For
Owner Type
Purchase Details
Closed on
Jan 9, 2026
Sold by
Bombardier Daniel and Bombardier Lisa A
Bought by
Follerr Austin and Follett Courtney
Current Estimated Value
Purchase Details
Closed on
Oct 16, 2025
Sold by
Latinville Ryan
Bought by
Lake Champs Prop Llc
Purchase Details
Closed on
Nov 14, 2017
Sold by
Salton Mary L
Bought by
Latinville Ryan
Home Financials for this Owner
Home Financials are based on the most recent Mortgage that was taken out on this home.
Original Mortgage
$56,000
Interest Rate
3.88%
Mortgage Type
Purchase Money Mortgage
Purchase Details
Closed on
Sep 10, 1999
Sold by
Salton Grace
Bought by
Salton Mary
Purchase Details
Closed on
Aug 27, 1996
Create a Home Valuation Report for This Property
The Home Valuation Report is an in-depth analysis detailing your home's value as well as a comparison with similar homes in the area
Home Values in the Area
Average Home Value in this Area
Purchase History
| Date | Buyer | Sale Price | Title Company |
|---|---|---|---|
| Follerr Austin | $325,000 | -- | |
| Lake Champs Prop Llc | -- | -- | |
| Latinville Ryan | $70,000 | -- | |
| Latinville Ryan | $70,000 | -- | |
| Salton Mary | -- | -- | |
| -- | -- | -- |
Source: Public Records
Mortgage History
| Date | Status | Borrower | Loan Amount |
|---|---|---|---|
| Previous Owner | Latinville Ryan | $56,000 |
Source: Public Records
Tax History
| Year | Tax Paid | Tax Assessment Tax Assessment Total Assessment is a certain percentage of the fair market value that is determined by local assessors to be the total taxable value of land and additions on the property. | Land | Improvement |
|---|---|---|---|---|
| 2025 | $1,722 | $130,500 | $23,500 | $107,000 |
| 2024 | $3,744 | $113,500 | $23,500 | $90,000 |
| 2023 | $3,736 | $107,800 | $23,500 | $84,300 |
| 2022 | $3,520 | $98,000 | $23,500 | $74,500 |
| 2021 | $3,205 | $80,000 | $23,500 | $56,500 |
| 2020 | $3,132 | $80,000 | $23,500 | $56,500 |
| 2019 | $1,270 | $70,000 | $23,500 | $46,500 |
| 2018 | $3,557 | $70,000 | $14,200 | $55,800 |
| 2017 | $1,923 | $107,100 | $14,200 | $92,900 |
| 2016 | $4,259 | $107,100 | $14,200 | $92,900 |
| 2015 | -- | $107,100 | $14,200 | $92,900 |
| 2014 | -- | $107,100 | $14,200 | $92,900 |
Source: Public Records
Map
Nearby Homes
Your Personal Tour Guide
Ask me questions while you tour the home.