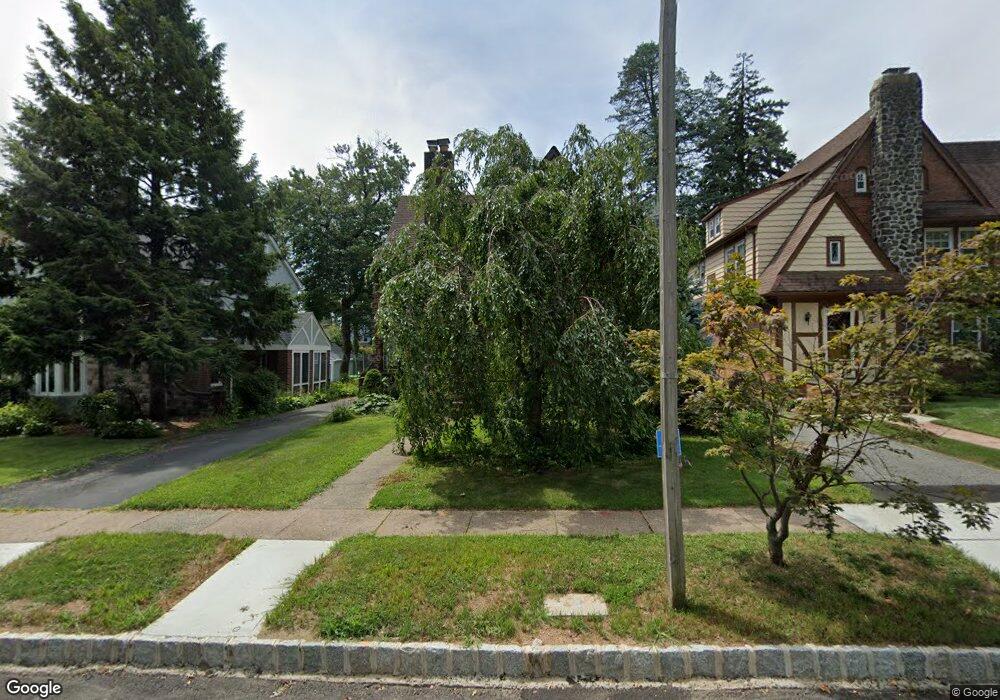
23 Stephen St Montclair, NJ 07042
Estimated Value: $1,271,000 - $1,435,000
5
Beds
4
Baths
2,235
Sq Ft
$601/Sq Ft
Est. Value
About This Home
This home is located at 23 Stephen St, Montclair, NJ 07042 and is currently estimated at $1,342,592, approximately $600 per square foot. 23 Stephen St is a home located in Essex County with nearby schools including Hillside School, Nishuane School, and Bradford School.
Ownership History
Date
Name
Owned For
Owner Type
Purchase Details
Closed on
Sep 14, 2007
Sold by
Mendez Perez Nancy
Bought by
Blaine Michael E and Blaine Sarah
Current Estimated Value
Home Financials for this Owner
Home Financials are based on the most recent Mortgage that was taken out on this home.
Original Mortgage
$688,500
Interest Rate
6.26%
Mortgage Type
Purchase Money Mortgage
Purchase Details
Closed on
Aug 17, 2006
Sold by
Griffith John
Bought by
Perez Nancy Mendez
Home Financials for this Owner
Home Financials are based on the most recent Mortgage that was taken out on this home.
Original Mortgage
$504,000
Interest Rate
6.75%
Mortgage Type
Adjustable Rate Mortgage/ARM
Create a Home Valuation Report for This Property
The Home Valuation Report is an in-depth analysis detailing your home's value as well as a comparison with similar homes in the area
Home Values in the Area
Average Home Value in this Area
Purchase History
| Date | Buyer | Sale Price | Title Company |
|---|---|---|---|
| Blaine Michael E | $765,000 | None Available | |
| Perez Nancy Mendez | $630,000 | -- |
Source: Public Records
Mortgage History
| Date | Status | Borrower | Loan Amount |
|---|---|---|---|
| Closed | Blaine Michael E | $688,500 | |
| Previous Owner | Perez Nancy Mendez | $504,000 |
Source: Public Records
Tax History
| Year | Tax Paid | Tax Assessment Tax Assessment Total Assessment is a certain percentage of the fair market value that is determined by local assessors to be the total taxable value of land and additions on the property. | Land | Improvement |
|---|---|---|---|---|
| 2025 | $23,325 | $690,100 | $340,600 | $349,500 |
| 2024 | $23,325 | $690,100 | $340,600 | $349,500 |
| 2022 | $22,690 | $690,100 | $340,600 | $349,500 |
| 2021 | $22,297 | $690,100 | $340,600 | $349,500 |
| 2020 | $21,938 | $690,100 | $340,600 | $349,500 |
| 2019 | $21,711 | $690,100 | $340,600 | $349,500 |
| 2018 | $21,352 | $690,100 | $340,600 | $349,500 |
| 2017 | $22,128 | $592,600 | $300,600 | $292,000 |
| 2016 | $21,255 | $584,900 | $300,600 | $284,300 |
| 2015 | $20,624 | $584,900 | $300,600 | $284,300 |
| 2014 | $19,933 | $584,900 | $300,600 | $284,300 |
Source: Public Records
Map
Nearby Homes
- 32 Dodd St
- 41 Glenridge Ave Unit 2L
- 3 Christopher Ct
- 166 Montclair Ave
- 281 Forest Ave
- 58 Yantecaw Ave
- 9 Glenfield Rd
- 17 Glen Ridge Pkwy
- 256 Forest Ave
- 734 Broad St
- 381 Essex Ave
- 15 Poe Ave
- 371 Essex Ave
- 9 Mount Vernon Rd
- 163 Park St
- 197 N Fullerton Ave
- 34 Skyview Rd
- 5 Inness Place
- 82 Watchung Ave Unit 84
Your Personal Tour Guide
Ask me questions while you tour the home.