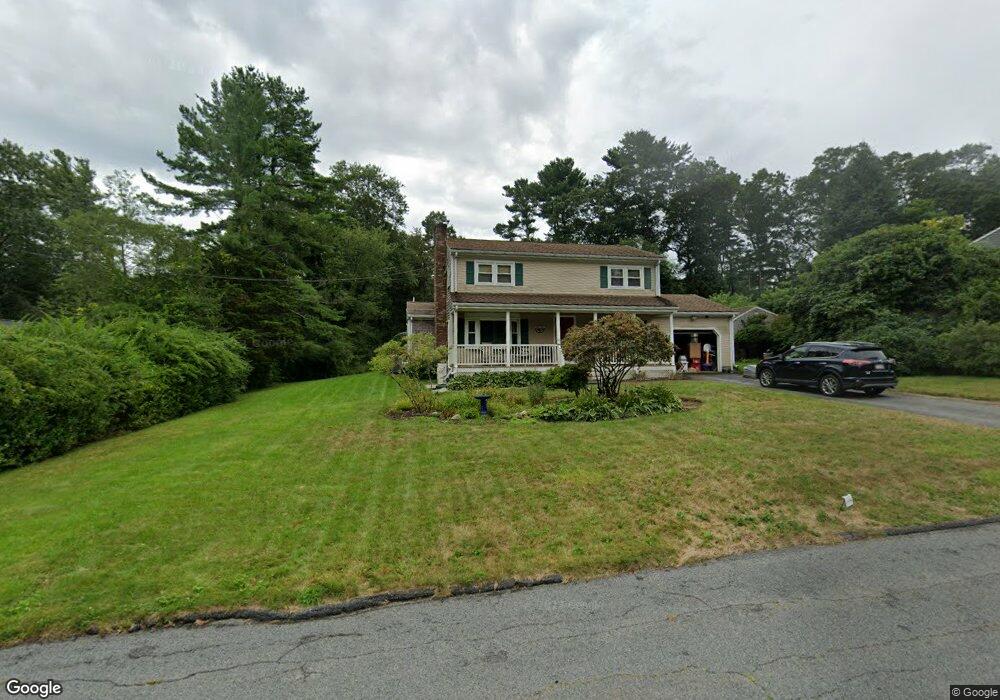
23 Steven Ave Westport, MA 02790
North Westport NeighborhoodEstimated Value: $455,000 - $646,000
4
Beds
--
Bath
1,896
Sq Ft
$285/Sq Ft
Est. Value
About This Home
This home is located at 23 Steven Ave, Westport, MA 02790 and is currently estimated at $540,502, approximately $285 per square foot. 23 Steven Ave is a home located in Bristol County with nearby schools including Alice A. Macomber Primary School, Westport Elementary School, and Westport Middle-High School.
Ownership History
Date
Name
Owned For
Owner Type
Purchase Details
Closed on
Jul 3, 2025
Sold by
Page Charles W and Page Joyce M
Bought by
Cj Page Irt and Seggelin
Current Estimated Value
Purchase Details
Closed on
Jan 26, 1973
Bought by
Page Charles W and Page Joyce M
Create a Home Valuation Report for This Property
The Home Valuation Report is an in-depth analysis detailing your home's value as well as a comparison with similar homes in the area
Home Values in the Area
Average Home Value in this Area
Purchase History
| Date | Buyer | Sale Price | Title Company |
|---|---|---|---|
| Cj Page Irt | -- | -- | |
| Cj Page Irt | -- | -- | |
| Cj Page Irt | -- | -- | |
| Page Charles W | -- | -- |
Source: Public Records
Mortgage History
| Date | Status | Borrower | Loan Amount |
|---|---|---|---|
| Previous Owner | Page Charles W | $20,000 | |
| Previous Owner | Page Charles W | $73,000 | |
| Previous Owner | Page Charles W | $50,000 | |
| Previous Owner | Page Charles W | $25,000 |
Source: Public Records
Tax History Compared to Growth
Tax History
| Year | Tax Paid | Tax Assessment Tax Assessment Total Assessment is a certain percentage of the fair market value that is determined by local assessors to be the total taxable value of land and additions on the property. | Land | Improvement |
|---|---|---|---|---|
| 2025 | $3,045 | $408,700 | $162,600 | $246,100 |
| 2024 | $3,022 | $391,000 | $150,600 | $240,400 |
| 2023 | $2,986 | $365,900 | $137,200 | $228,700 |
| 2022 | $2,722 | $327,100 | $124,700 | $202,400 |
| 2021 | $4,007 | $315,800 | $113,400 | $202,400 |
| 2020 | $3,995 | $311,300 | $108,900 | $202,400 |
| 2019 | $4,193 | $296,300 | $108,900 | $187,400 |
| 2018 | $4,132 | $305,700 | $109,900 | $195,800 |
| 2017 | $3,725 | $300,100 | $106,400 | $193,700 |
| 2016 | $2,283 | $288,600 | $102,900 | $185,700 |
| 2015 | $2,048 | $258,300 | $105,200 | $153,100 |
Source: Public Records
Map
Nearby Homes