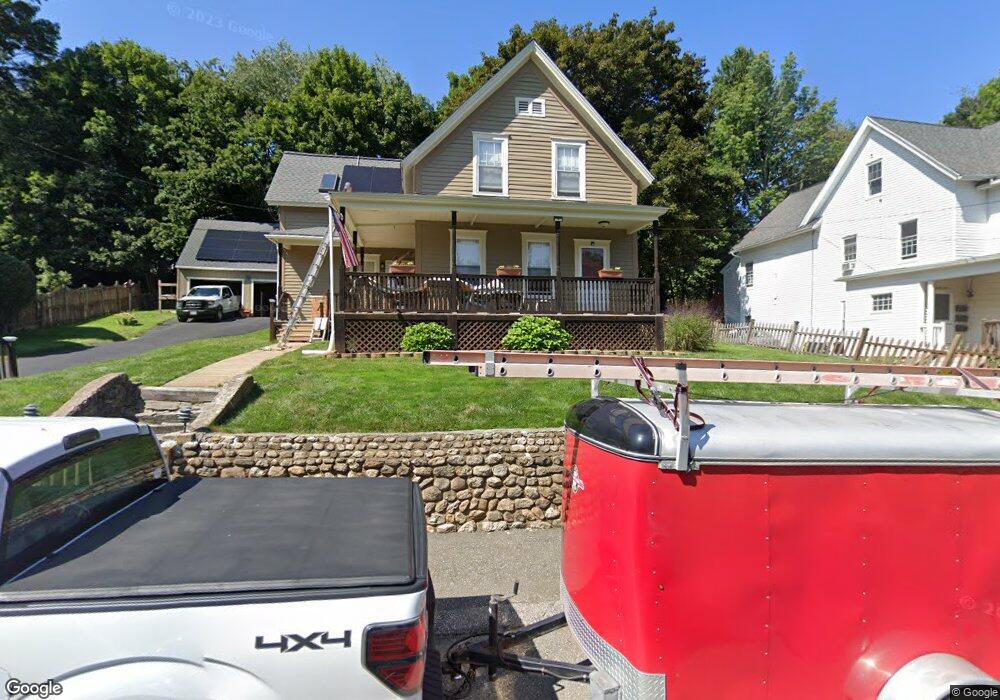
23 Summit St Spencer, MA 01562
Estimated Value: $329,000 - $401,000
3
Beds
1
Bath
1,460
Sq Ft
$252/Sq Ft
Est. Value
About This Home
This home is located at 23 Summit St, Spencer, MA 01562 and is currently estimated at $367,333, approximately $251 per square foot. 23 Summit St is a home located in Worcester County with nearby schools including David Prouty High School.
Ownership History
Date
Name
Owned For
Owner Type
Purchase Details
Closed on
Dec 12, 2024
Sold by
Cirba Robert J
Bought by
Cirba Robert J and Cirba Joy
Current Estimated Value
Home Financials for this Owner
Home Financials are based on the most recent Mortgage that was taken out on this home.
Original Mortgage
$520,500
Interest Rate
6.95%
Mortgage Type
Reverse Mortgage Home Equity Conversion Mortgage
Purchase Details
Closed on
Mar 11, 1992
Sold by
Constantine David and Constantin Michelle
Bought by
Cirba Robert J
Create a Home Valuation Report for This Property
The Home Valuation Report is an in-depth analysis detailing your home's value as well as a comparison with similar homes in the area
Home Values in the Area
Average Home Value in this Area
Purchase History
| Date | Buyer | Sale Price | Title Company |
|---|---|---|---|
| Cirba Robert J | -- | None Available | |
| Cirba Robert J | -- | None Available | |
| Cirba Robert J | $102,500 | -- | |
| Cirba Robert J | $102,500 | -- |
Source: Public Records
Mortgage History
| Date | Status | Borrower | Loan Amount |
|---|---|---|---|
| Previous Owner | Cirba Robert J | $520,500 | |
| Previous Owner | Cirba Robert J | $59,000 | |
| Previous Owner | Cirba Robert J | $100,000 |
Source: Public Records
Tax History
| Year | Tax Paid | Tax Assessment Tax Assessment Total Assessment is a certain percentage of the fair market value that is determined by local assessors to be the total taxable value of land and additions on the property. | Land | Improvement |
|---|---|---|---|---|
| 2025 | $3,267 | $278,300 | $37,500 | $240,800 |
| 2024 | $3,046 | $266,300 | $37,500 | $228,800 |
| 2023 | $2,890 | $239,600 | $37,500 | $202,100 |
| 2022 | $2,793 | $212,200 | $34,100 | $178,100 |
| 2021 | $2,762 | $196,700 | $34,100 | $162,600 |
| 2020 | $2,679 | $189,700 | $34,100 | $155,600 |
| 2019 | $2,511 | $181,200 | $29,900 | $151,300 |
| 2018 | $2,242 | $167,100 | $35,800 | $131,300 |
| 2017 | $2,212 | $158,200 | $34,100 | $124,100 |
| 2016 | $2,115 | $148,000 | $34,100 | $113,900 |
| 2015 | $2,055 | $150,300 | $39,200 | $111,100 |
| 2014 | $1,976 | $150,300 | $39,200 | $111,100 |
Source: Public Records
Map
Nearby Homes
Your Personal Tour Guide
Ask me questions while you tour the home.