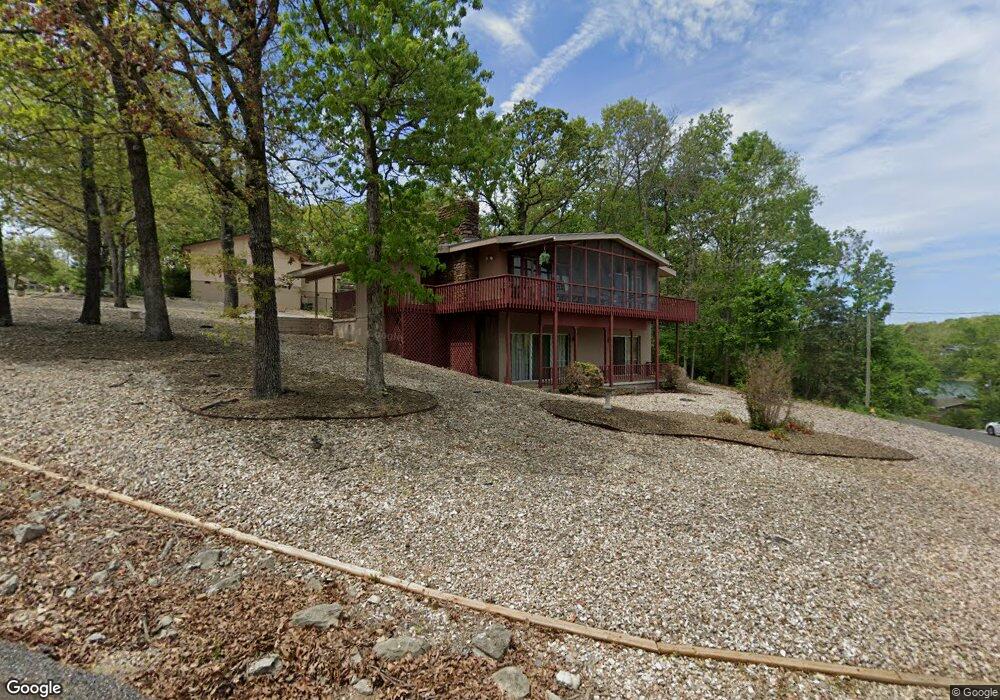
23 Swanage Dr Bella Vista, AR 72715
Estimated Value: $314,762 - $413,000
--
Bed
2
Baths
1,206
Sq Ft
$286/Sq Ft
Est. Value
About This Home
This home is located at 23 Swanage Dr, Bella Vista, AR 72715 and is currently estimated at $344,941, approximately $286 per square foot. 23 Swanage Dr is a home located in Benton County with nearby schools including Cooper Elementary School, Old High Middle School, and Washington Junior High School.
Ownership History
Date
Name
Owned For
Owner Type
Purchase Details
Closed on
Aug 9, 1998
Bought by
Dod 08-09-1998
Current Estimated Value
Purchase Details
Closed on
Jun 16, 1994
Bought by
Bohmont
Purchase Details
Closed on
Sep 8, 1992
Bought by
Alkire
Purchase Details
Closed on
Sep 26, 1991
Bought by
Stanton
Purchase Details
Closed on
Dec 3, 1986
Bought by
Stanton
Purchase Details
Closed on
Dec 30, 1985
Bought by
Dod 12-30-1985
Purchase Details
Closed on
Apr 12, 1982
Bought by
Stanton
Create a Home Valuation Report for This Property
The Home Valuation Report is an in-depth analysis detailing your home's value as well as a comparison with similar homes in the area
Home Values in the Area
Average Home Value in this Area
Purchase History
| Date | Buyer | Sale Price | Title Company |
|---|---|---|---|
| Dod 08-09-1998 | -- | -- | |
| Bohmont | $80,000 | -- | |
| Alkire | $69,000 | -- | |
| Stanton | $68,000 | -- | |
| Murphree | $60,000 | -- | |
| Stanton | -- | -- | |
| Dod 12-30-1985 | -- | -- | |
| Stanton | -- | -- |
Source: Public Records
Tax History Compared to Growth
Tax History
| Year | Tax Paid | Tax Assessment Tax Assessment Total Assessment is a certain percentage of the fair market value that is determined by local assessors to be the total taxable value of land and additions on the property. | Land | Improvement |
|---|---|---|---|---|
| 2025 | $920 | $50,440 | $1,600 | $48,840 |
| 2024 | $911 | $50,440 | $1,600 | $48,840 |
| 2023 | $911 | $33,180 | $800 | $32,380 |
| 2022 | $565 | $33,180 | $800 | $32,380 |
| 2021 | $563 | $33,180 | $800 | $32,380 |
| 2020 | $572 | $21,500 | $600 | $20,900 |
| 2019 | $572 | $21,500 | $600 | $20,900 |
| 2018 | $597 | $21,500 | $600 | $20,900 |
| 2017 | $561 | $21,500 | $600 | $20,900 |
| 2016 | $561 | $21,500 | $600 | $20,900 |
| 2015 | $896 | $20,830 | $1,000 | $19,830 |
| 2014 | $546 | $20,830 | $1,000 | $19,830 |
Source: Public Records
Map
Nearby Homes