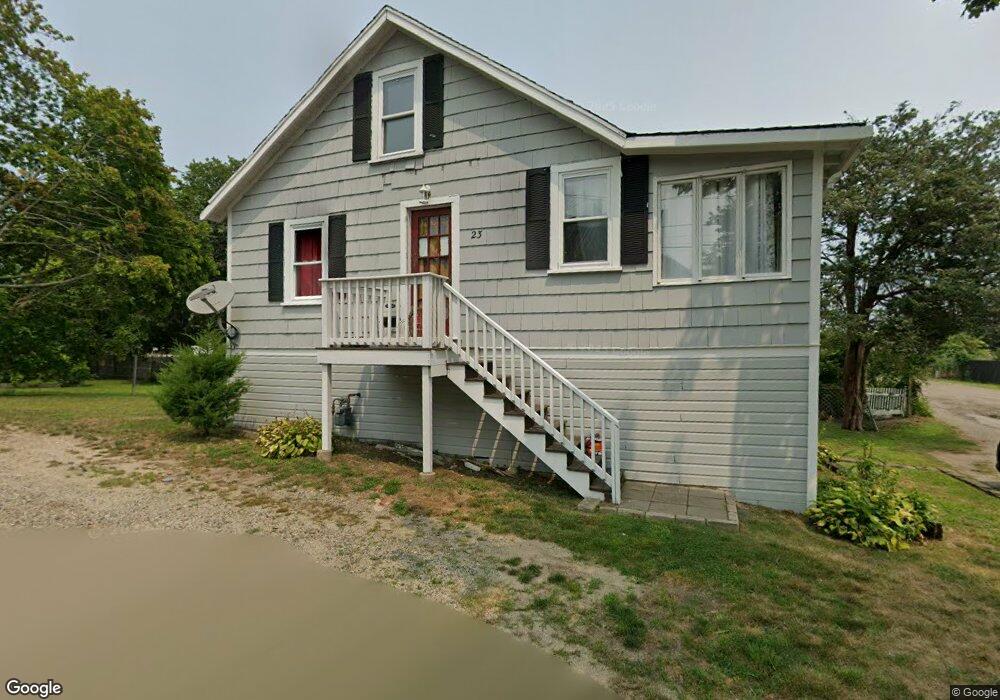
23 Sycamore Rd Marshfield, MA 02050
Estimated Value: $532,000 - $576,037
1
Bed
1
Bath
955
Sq Ft
$577/Sq Ft
Est. Value
About This Home
This home is located at 23 Sycamore Rd, Marshfield, MA 02050 and is currently estimated at $550,679, approximately $576 per square foot. 23 Sycamore Rd is a home located in Plymouth County with nearby schools including Eames Way School, Furnace Brook Middle School, and Marshfield High School.
Ownership History
Date
Name
Owned For
Owner Type
Purchase Details
Closed on
Sep 19, 2023
Sold by
Bobkat Real Estate Llc
Bought by
Ramos Candelida
Current Estimated Value
Home Financials for this Owner
Home Financials are based on the most recent Mortgage that was taken out on this home.
Original Mortgage
$436,500
Outstanding Balance
$426,828
Interest Rate
6.96%
Mortgage Type
Purchase Money Mortgage
Estimated Equity
$123,851
Purchase Details
Closed on
Apr 27, 2023
Sold by
Mcrae Arthur
Bought by
Bobkat Real Estate Llc
Home Financials for this Owner
Home Financials are based on the most recent Mortgage that was taken out on this home.
Original Mortgage
$300,000
Interest Rate
6.6%
Mortgage Type
Purchase Money Mortgage
Purchase Details
Closed on
Apr 26, 2019
Sold by
Mcrae Kevin
Bought by
Mcrae Arthur
Home Financials for this Owner
Home Financials are based on the most recent Mortgage that was taken out on this home.
Original Mortgage
$120,000
Interest Rate
4.3%
Mortgage Type
New Conventional
Create a Home Valuation Report for This Property
The Home Valuation Report is an in-depth analysis detailing your home's value as well as a comparison with similar homes in the area
Home Values in the Area
Average Home Value in this Area
Purchase History
| Date | Buyer | Sale Price | Title Company |
|---|---|---|---|
| Ramos Candelida | $450,000 | None Available | |
| Ramos Candelida | $450,000 | None Available | |
| Bobkat Real Estate Llc | $305,000 | None Available | |
| Bobkat Real Estate Llc | $305,000 | None Available | |
| Mcrae Arthur | $150,000 | -- | |
| Mcrae Arthur | $150,000 | -- |
Source: Public Records
Mortgage History
| Date | Status | Borrower | Loan Amount |
|---|---|---|---|
| Open | Ramos Candelida | $436,500 | |
| Closed | Ramos Candelida | $436,500 | |
| Previous Owner | Bobkat Real Estate Llc | $300,000 | |
| Previous Owner | Mcrae Arthur | $120,000 |
Source: Public Records
Tax History
| Year | Tax Paid | Tax Assessment Tax Assessment Total Assessment is a certain percentage of the fair market value that is determined by local assessors to be the total taxable value of land and additions on the property. | Land | Improvement |
|---|---|---|---|---|
| 2025 | $4,791 | $483,900 | $317,800 | $166,100 |
| 2024 | $4,978 | $479,100 | $298,000 | $181,100 |
| 2023 | $4,975 | $439,500 | $268,200 | $171,300 |
| 2022 | $4,744 | $366,300 | $228,400 | $137,900 |
| 2021 | $4,618 | $350,100 | $218,500 | $131,600 |
| 2020 | $4,186 | $314,000 | $188,700 | $125,300 |
| 2019 | $4,118 | $307,800 | $188,700 | $119,100 |
| 2018 | $4,115 | $307,800 | $188,700 | $119,100 |
| 2017 | $3,936 | $286,900 | $178,800 | $108,100 |
| 2016 | $3,774 | $271,900 | $168,800 | $103,100 |
| 2015 | $3,614 | $271,900 | $168,800 | $103,100 |
| 2014 | $3,513 | $264,300 | $168,800 | $95,500 |
Source: Public Records
Map
Nearby Homes
- 4 Summer St
- 3 Summer St
- 255 Ridge Rd
- 566 Holly Rd
- 1192 S River St
- 86 Telegraph Hill Rd
- 29 Spyglass Landing Dr
- 16 Schooner Way
- 10 Spyglass Landing Dr
- 39 High Beacon Way
- 55 Macombers Way
- 155 Quincy Ave
- 480 Pleasant St
- 1155 Main St
- 85 Constitution Rd
- 26 Damons Point Cir
- 14 Ferry St
- 889 Old Main Street Extension
- 92 Salt Meadow Waye
- 60 Samuel Curtis Way
Your Personal Tour Guide
Ask me questions while you tour the home.