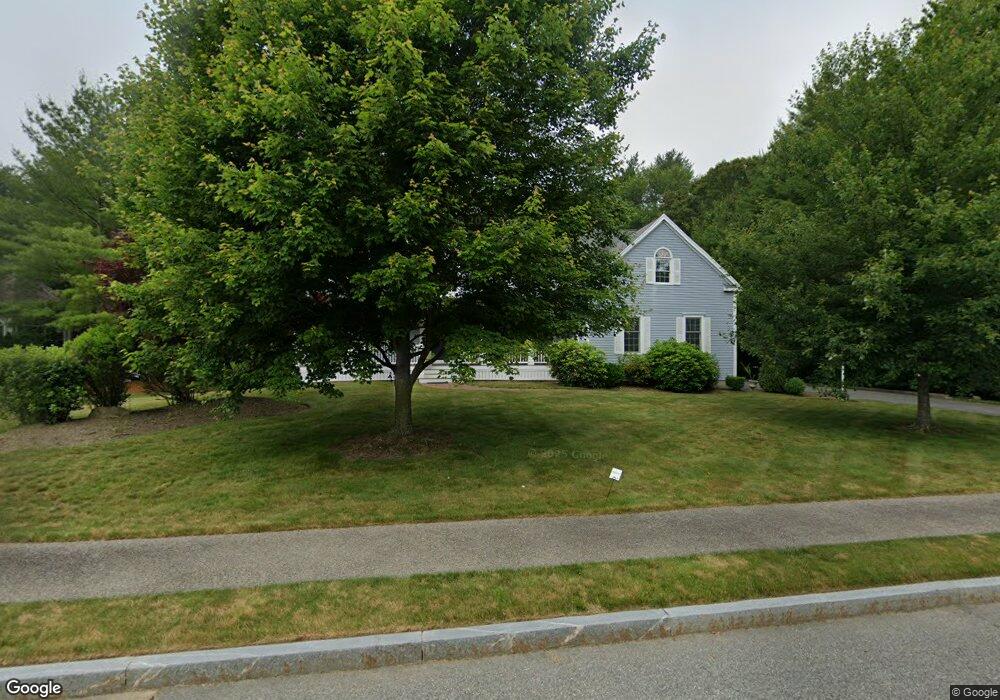
23 Symphony Dr North Easton, MA 02356
Estimated Value: $1,320,000 - $1,439,000
4
Beds
3
Baths
3,870
Sq Ft
$355/Sq Ft
Est. Value
About This Home
This home is located at 23 Symphony Dr, North Easton, MA 02356 and is currently estimated at $1,373,507, approximately $354 per square foot. 23 Symphony Dr is a home located in Bristol County with nearby schools including Easton Middle School.
Ownership History
Date
Name
Owned For
Owner Type
Purchase Details
Closed on
Aug 28, 2000
Sold by
Stonebridge Rt and Hashem Bisher I
Bought by
Eng Kenneth J and Eng Adina Eho
Current Estimated Value
Home Financials for this Owner
Home Financials are based on the most recent Mortgage that was taken out on this home.
Original Mortgage
$100,000
Outstanding Balance
$36,343
Interest Rate
8.06%
Mortgage Type
Purchase Money Mortgage
Estimated Equity
$1,337,164
Create a Home Valuation Report for This Property
The Home Valuation Report is an in-depth analysis detailing your home's value as well as a comparison with similar homes in the area
Home Values in the Area
Average Home Value in this Area
Purchase History
| Date | Buyer | Sale Price | Title Company |
|---|---|---|---|
| Eng Kenneth J | $503,088 | -- | |
| Eng Kenneth J | $503,088 | -- |
Source: Public Records
Mortgage History
| Date | Status | Borrower | Loan Amount |
|---|---|---|---|
| Open | Eng Kenneth J | $100,000 | |
| Closed | Eng Kenneth J | $100,000 |
Source: Public Records
Tax History Compared to Growth
Tax History
| Year | Tax Paid | Tax Assessment Tax Assessment Total Assessment is a certain percentage of the fair market value that is determined by local assessors to be the total taxable value of land and additions on the property. | Land | Improvement |
|---|---|---|---|---|
| 2025 | $14,510 | $1,162,700 | $460,400 | $702,300 |
| 2024 | $15,493 | $1,160,500 | $406,000 | $754,500 |
| 2023 | $13,881 | $951,400 | $389,700 | $561,700 |
| 2022 | $13,137 | $853,600 | $312,800 | $540,800 |
| 2021 | $12,681 | $819,200 | $278,400 | $540,800 |
| 2020 | $12,358 | $803,500 | $278,400 | $525,100 |
| 2019 | $12,594 | $789,100 | $278,300 | $510,800 |
| 2018 | $12,384 | $764,000 | $285,700 | $478,300 |
| 2017 | $11,867 | $731,600 | $285,700 | $445,900 |
| 2016 | $11,535 | $712,500 | $288,300 | $424,200 |
| 2015 | $11,038 | $657,800 | $233,600 | $424,200 |
| 2014 | $10,966 | $658,600 | $239,800 | $418,800 |
Source: Public Records
Map
Nearby Homes
- 23 Tanglewood Dr
- 441 Foundry St
- 416 Foundry St
- 431 Depot St - L4 Overlook Ln
- 64 South St
- 10 Matthew Cir
- 531 Foundry St Unit E
- 531 Foundry St Unit D
- 531 Foundry St Unit A
- 531 Foundry St Unit C
- 17 Gaslight Ln
- 1 Newell Cir
- 2 Ford Cir
- 20 Coach Rd
- 3 Coach Rd
- 23 Cutter Dr
- Starling Plan at Sawmill Village
- Mallard Plan at Sawmill Village
- Goldfinch Plan at Sawmill Village
- Falcon Plan at Sawmill Village