Estimated Value: $524,000 - $894,497
5
Beds
3
Baths
4,844
Sq Ft
$157/Sq Ft
Est. Value
About This Home
This home is located at 23 Szych Rd, Union, CT 06076 and is currently estimated at $758,166, approximately $156 per square foot. 23 Szych Rd is a home located in Tolland County with nearby schools including Union Elementary School.
Ownership History
Date
Name
Owned For
Owner Type
Purchase Details
Closed on
Oct 15, 2013
Sold by
Gonzalez Isabelino
Bought by
Gonzalez Sara
Current Estimated Value
Purchase Details
Closed on
Apr 24, 2008
Sold by
Deutsche Bank Natl T C
Bought by
Gonzalez Sara and Gonzalez Isabelino
Home Financials for this Owner
Home Financials are based on the most recent Mortgage that was taken out on this home.
Original Mortgage
$200,000
Interest Rate
6.22%
Purchase Details
Closed on
Mar 16, 2006
Sold by
Luginbuhl John
Bought by
Carbonell Paul and Bates Odessa
Home Financials for this Owner
Home Financials are based on the most recent Mortgage that was taken out on this home.
Original Mortgage
$332,000
Interest Rate
6.27%
Purchase Details
Closed on
Sep 19, 2000
Sold by
Szych Steven and Szych Carl
Bought by
Holland Michael
Create a Home Valuation Report for This Property
The Home Valuation Report is an in-depth analysis detailing your home's value as well as a comparison with similar homes in the area
Home Values in the Area
Average Home Value in this Area
Purchase History
| Date | Buyer | Sale Price | Title Company |
|---|---|---|---|
| Gonzalez Sara | -- | -- | |
| Gonzalez Sara | $342,000 | -- | |
| Carbonell Paul | $415,000 | -- | |
| Holland Michael | $129,300 | -- |
Source: Public Records
Mortgage History
| Date | Status | Borrower | Loan Amount |
|---|---|---|---|
| Previous Owner | Holland Michael | $200,000 | |
| Previous Owner | Holland Michael | $332,000 | |
| Previous Owner | Holland Michael | $83,000 |
Source: Public Records
Tax History
| Year | Tax Paid | Tax Assessment Tax Assessment Total Assessment is a certain percentage of the fair market value that is determined by local assessors to be the total taxable value of land and additions on the property. | Land | Improvement |
|---|---|---|---|---|
| 2025 | $14,119 | $596,260 | $52,110 | $544,150 |
| 2024 | $13,583 | $596,260 | $52,110 | $544,150 |
| 2023 | $12,039 | $424,650 | $41,440 | $383,210 |
| 2022 | $11,827 | $424,650 | $41,440 | $383,210 |
| 2021 | $12,145 | $424,650 | $41,440 | $383,210 |
| 2020 | $12,311 | $424,650 | $41,440 | $383,210 |
| 2019 | $13,134 | $424,650 | $41,440 | $383,210 |
| 2018 | $11,675 | $375,400 | $50,120 | $325,280 |
| 2017 | $11,577 | $375,400 | $50,120 | $325,280 |
| 2015 | $11,112 | $375,400 | $50,120 | $325,280 |
| 2014 | $10,519 | $362,740 | $37,460 | $325,280 |
Source: Public Records
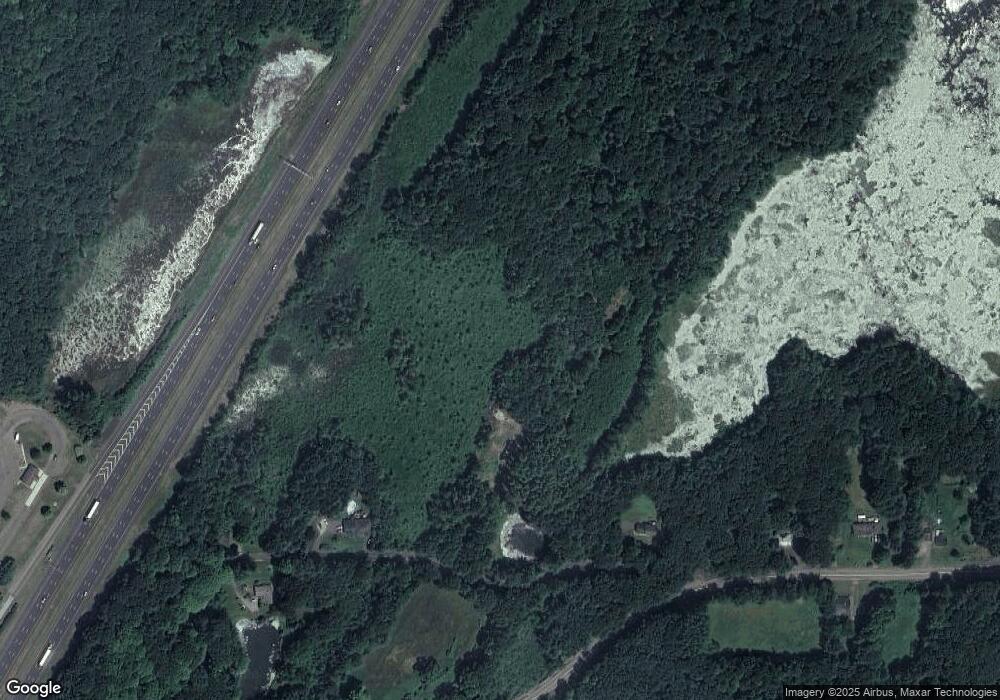
Map
Nearby Homes
- 894 Buckley Hwy
- 425 Stickney Hill Rd
- 2 Old Barrows Rd
- 25 Lead Mine Rd
- 441 Stickney Hill Rd
- 15 Cherokee Rd
- 88 Stafford Holland Rd
- 144 Hnath Rd
- 198 Union Rd
- 0 Rr 197 Rd
- 113 Michelec Rd
- 151 Wales Rd
- 237 Upper Rd
- 37 Potter School Rd
- 31 Lake Shore Blvd
- 24 Lake Shore Blvd
- 46 Dogwood Ln
- 174 Stafford St
- 118 Lake Shore Blvd
- 87 Vinton Rd
- 26 Szych Rd
- 898 Buckley Hwy
- 17 Szych Rd
- 1 Szych Rd
- 0 Szych Rd Unit 170123277
- 0 Szych Rd Unit 170083990
- 0 Szych Rd Unit G10220317
- 0 Szych Rd
- 0 Szych Rd Unit G500489
- 0 Szych Rd Unit 170193637
- 899 Buckley Hwy
- 892 Buckley Hwy
- 897 Buckley Hwy
- 901 Scranton Brook Ln
- 901 Scranton Brook Ln
- 901 Scranton Brook Ln
- 901 Scranton Brook Ln
- 931 Buckley Hwy
- 934 Buckley Hwy
- 886 Buckley Hwy
Your Personal Tour Guide
Ask me questions while you tour the home.