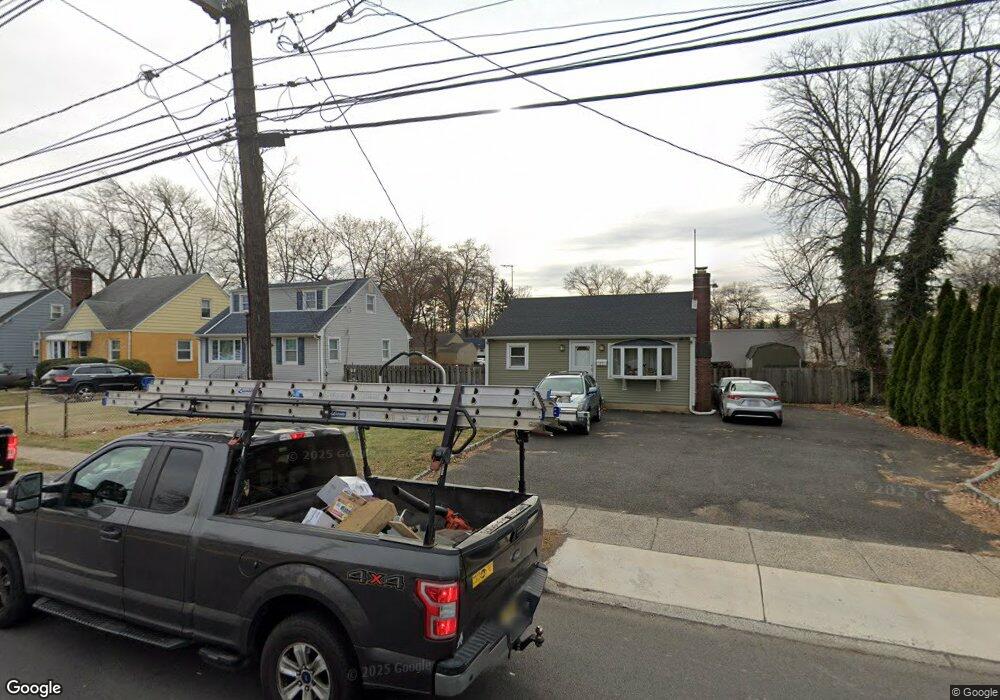
23 Terrill Rd Unit 29 Plainfield, NJ 07062
Estimated Value: $342,946 - $422,000
Studio
--
Bath
754
Sq Ft
$516/Sq Ft
Est. Value
About This Home
This home is located at 23 Terrill Rd Unit 29, Plainfield, NJ 07062 and is currently estimated at $388,737, approximately $515 per square foot. 23 Terrill Rd Unit 29 is a home located in Union County with nearby schools including Emerson Community School, Maxson Middle School, and Plainfield High School.
Ownership History
Date
Name
Owned For
Owner Type
Purchase Details
Closed on
Feb 21, 2005
Sold by
Ramirez Mario E Cabrera
Bought by
Ramirez Mario E Cabrera
Current Estimated Value
Home Financials for this Owner
Home Financials are based on the most recent Mortgage that was taken out on this home.
Original Mortgage
$138,000
Outstanding Balance
$69,728
Interest Rate
5.66%
Estimated Equity
$319,009
Purchase Details
Closed on
Aug 13, 2001
Sold by
Ponzio Joseph
Bought by
Cabrera Mario
Home Financials for this Owner
Home Financials are based on the most recent Mortgage that was taken out on this home.
Original Mortgage
$113,223
Interest Rate
7.21%
Mortgage Type
FHA
Purchase Details
Closed on
May 12, 1997
Sold by
Blaine Lathell N and Blaine Carole D
Bought by
Ponzio Joseph
Home Financials for this Owner
Home Financials are based on the most recent Mortgage that was taken out on this home.
Original Mortgage
$70,000
Interest Rate
7.88%
Mortgage Type
Balloon
Create a Home Valuation Report for This Property
The Home Valuation Report is an in-depth analysis detailing your home's value as well as a comparison with similar homes in the area
Home Values in the Area
Average Home Value in this Area
Purchase History
| Date | Buyer | Sale Price | Title Company |
|---|---|---|---|
| Ramirez Mario E Cabrera | -- | -- | |
| Cabrera Mario | $115,000 | -- | |
| Ponzio Joseph | $90,000 | -- |
Source: Public Records
Mortgage History
| Date | Status | Borrower | Loan Amount |
|---|---|---|---|
| Open | Ramirez Mario E Cabrera | $138,000 | |
| Previous Owner | Cabrera Mario | $113,223 | |
| Previous Owner | Ponzio Joseph | $70,000 |
Source: Public Records
Tax History
| Year | Tax Paid | Tax Assessment Tax Assessment Total Assessment is a certain percentage of the fair market value that is determined by local assessors to be the total taxable value of land and additions on the property. | Land | Improvement |
|---|---|---|---|---|
| 2025 | $8,313 | $95,200 | $52,100 | $43,100 |
| 2024 | $8,231 | $95,200 | $52,100 | $43,100 |
| 2023 | $8,231 | $95,200 | $52,100 | $43,100 |
| 2022 | $8,053 | $95,200 | $52,100 | $43,100 |
| 2021 | $7,983 | $95,200 | $52,100 | $43,100 |
| 2020 | $7,960 | $95,200 | $52,100 | $43,100 |
| 2019 | $7,960 | $95,200 | $52,100 | $43,100 |
| 2018 | $7,793 | $95,200 | $52,100 | $43,100 |
| 2017 | $7,603 | $95,200 | $52,100 | $43,100 |
| 2016 | $7,448 | $95,200 | $52,100 | $43,100 |
| 2015 | $7,228 | $95,200 | $52,100 | $43,100 |
| 2014 | $7,031 | $95,200 | $52,100 | $43,100 |
Source: Public Records
Map
Nearby Homes
- 344 Hoe Ave
- 1412 E 2nd St Unit 16
- 56-58 Raymond Ave
- 58 Raymond Ave
- 535 Farley Ave
- 5 Cecilia Place
- 93 Raymond Ave
- 95 Raymond Ave Unit 97
- 317 Willow Ave
- 124 Hillcrest Ave
- 220 Terrill Rd Unit 22
- 431 Willow Ave
- 213 Myrtle Ave
- 225 Sumner Ave Unit 27
- 1224 E 2nd St Unit 30
- 8 Village Park Ct Unit 8
- 263 Colonial Place Unit 65
- 230 Pinehurst Ave
- 1415 George St Unit 23
- 1364 George St
- 19 Terrill Rd Unit 21
- 31-37 Terrill Rd
- 31 Terrill Rd Unit 37
- 15 Terrill Rd Unit 17
- 1452 Summer Ave Unit 62
- 13 Terrill Rd
- 20 Wiley Ave Unit 24
- 20-24 Wiley Ave
- 363 Terrill Rd
- 349 Terrill Rd
- 349 Terrill Rd
- 43 Terrill Rd
- 14 Wiley Ave Unit 18
- 347 Terrill Rd
- 2 Wiley Ave
- 45 Terrill Rd
- 1469 E Front St
- 49 Terrill Rd
- 1508 Gables St
- 8 Wiley Ave Unit 12
Your Personal Tour Guide
Ask me questions while you tour the home.