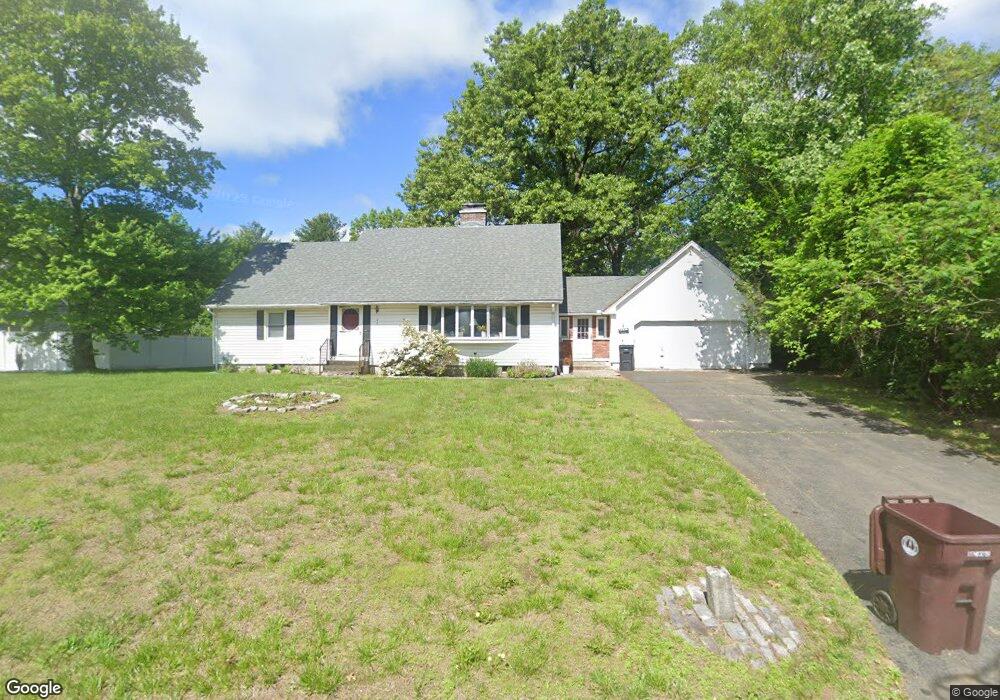
23 Tow Path Ln Westfield, MA 01085
Estimated Value: $423,000 - $534,000
5
Beds
2
Baths
2,015
Sq Ft
$234/Sq Ft
Est. Value
About This Home
This home is located at 23 Tow Path Ln, Westfield, MA 01085 and is currently estimated at $472,166, approximately $234 per square foot. 23 Tow Path Ln is a home located in Hampden County with nearby schools including Westfield High School and Saint Mary High School.
Ownership History
Date
Name
Owned For
Owner Type
Purchase Details
Closed on
Nov 2, 2018
Sold by
Sgueglia Pamela M and Sgueglia David E
Bought by
Sgueglia Pamela
Current Estimated Value
Home Financials for this Owner
Home Financials are based on the most recent Mortgage that was taken out on this home.
Original Mortgage
$176,000
Outstanding Balance
$154,121
Interest Rate
4.6%
Mortgage Type
New Conventional
Estimated Equity
$318,045
Purchase Details
Closed on
Jun 20, 1997
Sold by
Kruschwitz David M and Kruschwitz Marie L
Bought by
Sgueglia David E and Sgueglia Pamela M
Purchase Details
Closed on
Aug 23, 1996
Sold by
Paredes Javier E and Paredes Mary K
Bought by
Kruschwitz David M and Kruschwitz Marie L
Create a Home Valuation Report for This Property
The Home Valuation Report is an in-depth analysis detailing your home's value as well as a comparison with similar homes in the area
Home Values in the Area
Average Home Value in this Area
Purchase History
| Date | Buyer | Sale Price | Title Company |
|---|---|---|---|
| Sgueglia Pamela | -- | -- | |
| Sgueglia David E | $156,000 | -- | |
| Kruschwitz David M | $156,000 | -- |
Source: Public Records
Mortgage History
| Date | Status | Borrower | Loan Amount |
|---|---|---|---|
| Open | Sgueglia Pamela | $176,000 | |
| Previous Owner | Kruschwitz David M | $32,000 | |
| Previous Owner | Kruschwitz David M | $154,800 |
Source: Public Records
Tax History Compared to Growth
Tax History
| Year | Tax Paid | Tax Assessment Tax Assessment Total Assessment is a certain percentage of the fair market value that is determined by local assessors to be the total taxable value of land and additions on the property. | Land | Improvement |
|---|---|---|---|---|
| 2025 | $5,248 | $345,700 | $120,200 | $225,500 |
| 2024 | $5,248 | $328,600 | $109,200 | $219,400 |
| 2023 | $5,071 | $296,700 | $103,800 | $192,900 |
| 2022 | $4,855 | $262,600 | $92,800 | $169,800 |
| 2021 | $3,071 | $249,300 | $87,600 | $161,700 |
| 2020 | $4,564 | $237,100 | $87,600 | $149,500 |
| 2019 | $4,461 | $226,800 | $83,400 | $143,400 |
| 2018 | $2,893 | $226,800 | $83,400 | $143,400 |
| 2017 | $4,774 | $221,600 | $84,400 | $137,200 |
| 2016 | $4,308 | $221,600 | $84,400 | $137,200 |
| 2015 | $4,108 | $221,600 | $84,400 | $137,200 |
| 2014 | $3,073 | $221,600 | $84,400 | $137,200 |
Source: Public Records
Map
Nearby Homes
- 16 Locust St
- 76 Shaker Rd
- 0 E Mountain Rd
- 189 Springfield Rd Unit 23
- 0 Feeding Hills Rd
- 103 Feeding Hills Rd
- 120 Woodcliff Dr
- 57 Falley Dr
- 242 Eastwood Dr
- 161 Wildflower Cir
- 30 Cross St
- 13 William St
- 25 White St
- 119 Union St Unit 4
- 162 Joseph Ave
- 16 Yale St
- 1037 Shaker Rd
- 901 Shaker Rd
- 17 Jeanne Marie Dr
- 32 Noble Ave
- 27 Tow Path Ln
- 16 Tow Path Ln
- 15 Tow Path Ln
- 28 Tow Path Ln
- 32 Tow Path Ln
- 0 Tow Path Ln
- 11 Tow Path Ln
- 10 Tow Path Ln
- 9 Tow Path Ln
- 6 Tow Path Ln
- 487 E Main St
- 7 Tow Path Ln
- 2 Tow Path Ln
- 49 Little River Rd
- 21 Ridgecrest Cir
- 93 Little River Rd
- 25 Ridgecrest Cir
- 15 Ridgecrest Cir
- 107 Little River Rd
- 9 Ridgecrest Cir