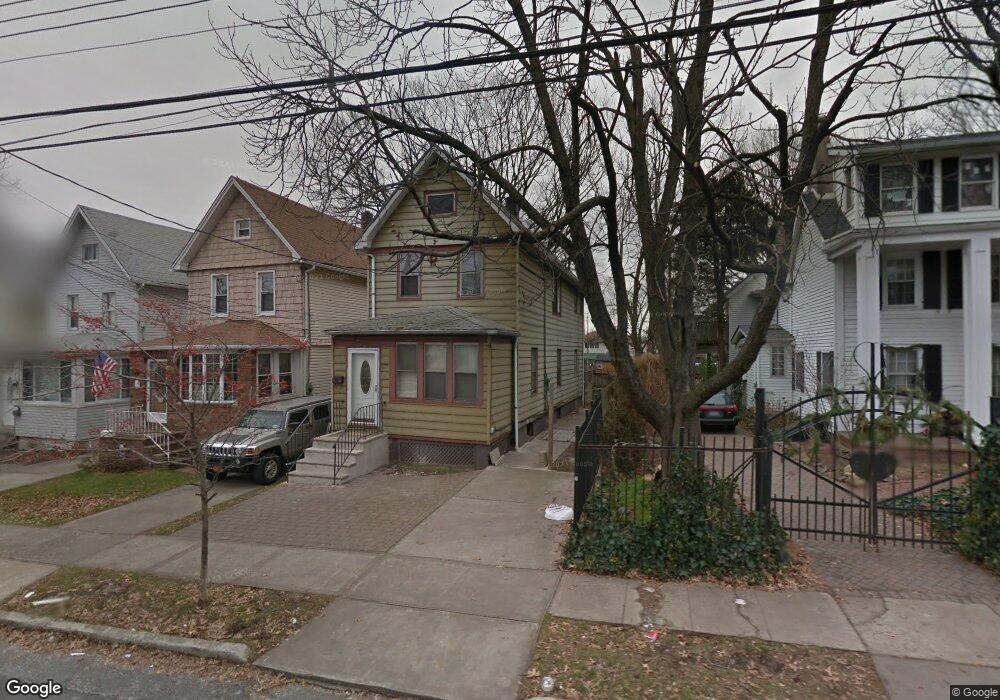
23 Trantor Place Staten Island, NY 10302
Port Richmond NeighborhoodEstimated Value: $447,000 - $671,000
4
Beds
2
Baths
1,304
Sq Ft
$425/Sq Ft
Est. Value
About This Home
This home is located at 23 Trantor Place, Staten Island, NY 10302 and is currently estimated at $554,818, approximately $425 per square foot. 23 Trantor Place is a home located in Richmond County with nearby schools including PS 21 Margaret Emery-Elm Park, I.S. 51 Edwin Markham, and Port Richmond High School.
Ownership History
Date
Name
Owned For
Owner Type
Purchase Details
Closed on
Sep 6, 2016
Sold by
Deutsche Bank National Trust Company
Bought by
Adimoolam Raja
Current Estimated Value
Purchase Details
Closed on
Jun 19, 2014
Sold by
Williams Clarice R
Bought by
Deutsche Bank National Trust Company
Purchase Details
Closed on
Oct 28, 1998
Sold by
Johnson Roberta
Bought by
Williams Clarice R
Home Financials for this Owner
Home Financials are based on the most recent Mortgage that was taken out on this home.
Original Mortgage
$121,984
Interest Rate
6.8%
Mortgage Type
FHA
Purchase Details
Closed on
Mar 31, 1997
Sold by
Johnson Roberta and Garcia Richard
Bought by
Johnson Roberta
Create a Home Valuation Report for This Property
The Home Valuation Report is an in-depth analysis detailing your home's value as well as a comparison with similar homes in the area
Home Values in the Area
Average Home Value in this Area
Purchase History
| Date | Buyer | Sale Price | Title Company |
|---|---|---|---|
| Adimoolam Raja | $224,945 | None Available | |
| Deutsche Bank National Trust Company | $1,000 | Ticor Title Insurance Co | |
| Williams Clarice R | $123,000 | -- | |
| Johnson Roberta | -- | First American Title Ins Co |
Source: Public Records
Mortgage History
| Date | Status | Borrower | Loan Amount |
|---|---|---|---|
| Previous Owner | Williams Clarice R | $121,984 |
Source: Public Records
Tax History Compared to Growth
Tax History
| Year | Tax Paid | Tax Assessment Tax Assessment Total Assessment is a certain percentage of the fair market value that is determined by local assessors to be the total taxable value of land and additions on the property. | Land | Improvement |
|---|---|---|---|---|
| 2025 | $3,818 | $33,120 | $5,183 | $27,937 |
| 2024 | $3,818 | $29,460 | $5,497 | $23,963 |
| 2023 | $3,860 | $19,008 | $5,855 | $13,153 |
| 2022 | $3,766 | $22,500 | $8,520 | $13,980 |
| 2021 | $3,745 | $23,640 | $8,520 | $15,120 |
| 2020 | $3,554 | $21,420 | $8,520 | $12,900 |
| 2019 | $3,314 | $21,240 | $8,520 | $12,720 |
| 2018 | $3,229 | $15,840 | $5,567 | $10,273 |
| 2017 | $3,204 | $15,720 | $7,567 | $8,153 |
| 2016 | $2,965 | $14,831 | $7,188 | $7,643 |
| 2015 | $2,533 | $13,992 | $6,475 | $7,517 |
| 2014 | $2,533 | $13,200 | $7,080 | $6,120 |
Source: Public Records
Map
Nearby Homes
- 98 Saint Josephs Ave
- 38 Laforge Ave
- 145 Clinton Place
- 162 John St
- 211 Morningstar Rd
- 28 Hooker Place
- 145 Morningside Ave Unit 2C
- 209 Nicholas Ave
- 11 Laforge Ave
- 469 Port Richmond Ave
- 231 Charles Ave
- 306 Morningstar Rd
- 152 Port Richmond Ave
- 322 Morningstar Rd
- 325 Pulaski Ave
- 327 Pulaski Ave
- 329 Pulaski Ave
- 331 Pulaski Ave
- 47 Montell St
- 28 Clinton Place
- 21 Trantor Place
- 29 Trantor Place
- 17 Trantor Place
- 15 Trantor Place
- 31 Trantor Place
- 35 Trantor Place
- 37 Trantor Place
- 30 Innis St
- 34 Innis St
- 290 Nicholas Ave
- 288 Nicholas Ave
- 26 Innis St
- 38 Innis St
- 286 Nicholas Ave Unit 290
- 286-290 Nicholas Ave
- 294 Nicholas Ave
- 282 Nicholas Ave
- 284 Nicholas Ave
- 22 Innis St
- 300 Nicholas Ave