Estimated Value: $282,660 - $341,000
--
Bed
--
Bath
1,631
Sq Ft
$192/Sq Ft
Est. Value
About This Home
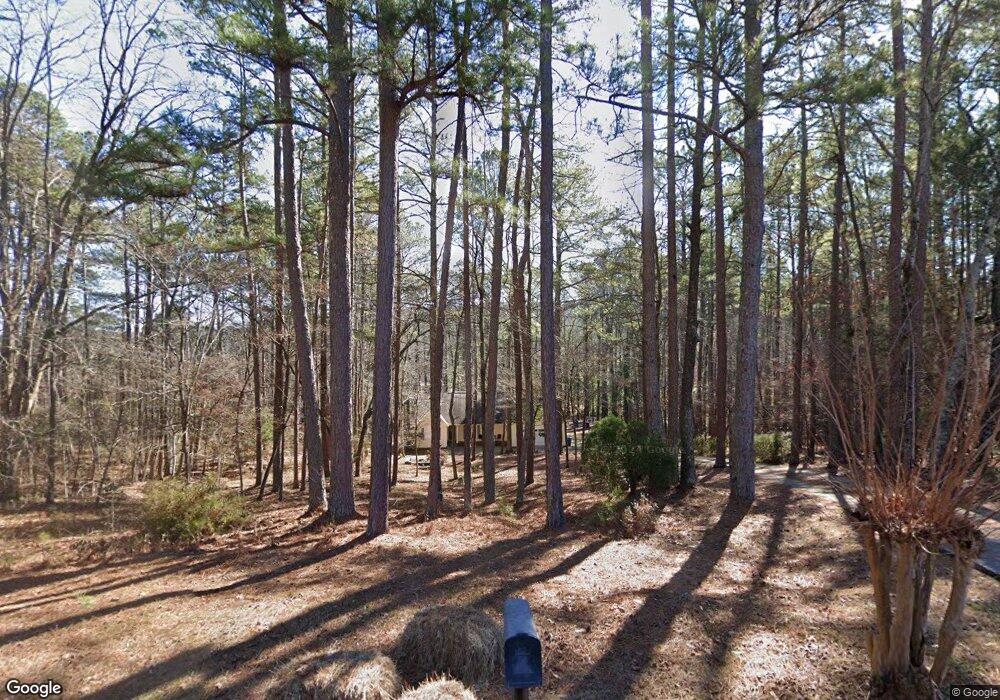
This home is located at 23 Twickenham Rd SE, Rome, GA 30161 and is currently estimated at $312,915, approximately $191 per square foot. 23 Twickenham Rd SE is a home located in Floyd County with nearby schools including Pepperell Middle School, Pepperell High School, and Montessori School of Rome.
Ownership History
Date
Name
Owned For
Owner Type
Purchase Details
Closed on
May 18, 2015
Sold by
Grizzle David E
Bought by
Vigoa Felipe J
Current Estimated Value
Home Financials for this Owner
Home Financials are based on the most recent Mortgage that was taken out on this home.
Original Mortgage
$139,650
Outstanding Balance
$108,009
Interest Rate
3.79%
Mortgage Type
New Conventional
Estimated Equity
$204,906
Purchase Details
Closed on
Jun 27, 1996
Sold by
Byrne Michael S and Byrne Tracey S
Bought by
Grizzle David E
Purchase Details
Closed on
May 13, 1994
Sold by
Nida John A and Nida Erin
Bought by
Byrne Michael S and Byrne Tracey S
Purchase Details
Closed on
Oct 14, 1991
Bought by
P and R
Purchase Details
Closed on
May 10, 1991
Sold by
Nida John A
Bought by
Nida John A and Nida Erin
Purchase Details
Closed on
Feb 21, 1991
Sold by
Sweet Mary Duncan
Bought by
Nida John A
Purchase Details
Closed on
Jan 1, 1974
Sold by
Sweet Warlter E
Bought by
Sweet Mary Duncan
Purchase Details
Closed on
Jan 1, 1901
Bought by
Sweet Warlter E
Create a Home Valuation Report for This Property
The Home Valuation Report is an in-depth analysis detailing your home's value as well as a comparison with similar homes in the area
Home Values in the Area
Average Home Value in this Area
Purchase History
| Date | Buyer | Sale Price | Title Company |
|---|---|---|---|
| Vigoa Felipe J | $147,000 | -- | |
| Grizzle David E | $123,000 | -- | |
| Byrne Michael S | $115,000 | -- | |
| P | -- | -- | |
| Nida John A | -- | -- | |
| Nida John A | $5,000 | -- | |
| Sweet Mary Duncan | -- | -- | |
| Sweet Warlter E | -- | -- |
Source: Public Records
Mortgage History
| Date | Status | Borrower | Loan Amount |
|---|---|---|---|
| Open | Vigoa Felipe J | $139,650 |
Source: Public Records
Tax History Compared to Growth
Tax History
| Year | Tax Paid | Tax Assessment Tax Assessment Total Assessment is a certain percentage of the fair market value that is determined by local assessors to be the total taxable value of land and additions on the property. | Land | Improvement |
|---|---|---|---|---|
| 2024 | $4,048 | $117,454 | $15,196 | $102,258 |
| 2023 | $4,160 | $108,237 | $13,408 | $94,829 |
| 2022 | $3,342 | $91,591 | $10,726 | $80,865 |
| 2021 | $3,151 | $84,918 | $10,726 | $74,192 |
| 2020 | $2,811 | $75,135 | $8,492 | $66,643 |
| 2019 | $2,514 | $67,912 | $8,492 | $59,420 |
| 2018 | $2,413 | $65,192 | $8,492 | $56,700 |
| 2017 | $2,308 | $62,336 | $8,492 | $53,844 |
| 2016 | $2,184 | $61,600 | $8,480 | $53,120 |
| 2015 | $1,815 | $61,398 | $8,480 | $52,918 |
| 2014 | $1,815 | $61,398 | $8,480 | $52,918 |
Source: Public Records
Map
Nearby Homes
- 11 Cambridge Dr SE
- 14 Wellington Way SE
- 0 Wellington Way SE Unit 7374604
- 0 Wellington Way SE Unit 7374602
- 0 Wellington Way SE Unit 20180069
- 0 Wellington Way SE Unit 20180068
- 18 Wellington Way SE
- 85 Cambridge Dr SE
- 38 Coventry Dr SE
- 36 Coventry Dr SE
- 35 Cumberland Dr SE
- 52 Twickenham Rd SE
- 519 Dr SE
- 22 Coventry Dr SE
- 211 Chateau Dr SE
- 20 Coventry Dr SE
- 18 Devonshire Dr SE
- 14 Warwick Way SE
- 20 Warwick Way SE
- 0 Warwick Way SE Unit 7666193
- 21 Twickenham Rd SE
- 19 Twickenham Rd SE
- 10 Margo Trail SE
- 12 Margo Trail SE
- 12 Margo Trail SE Unit Tr
- 8 Margo Trail SE
- 14 Margo Trail SE
- 28 Twickenham Rd SE
- 28 Twickenham Rd SE
- 28 Twickenham Rd SE Unit 200
- 6 Margo Trail SE
- 85 Margo Trail SE
- 26 Twickenham Rd SE
- 24 Twickenham Rd SE
- 18 Twickenham Rd SE
- 20 Twickenham Rd SE
- 18 Margo Trail SE
- 2 Margo Trail SE
- 22 Twickenham Rd SE
- 20 Margo Trail SE