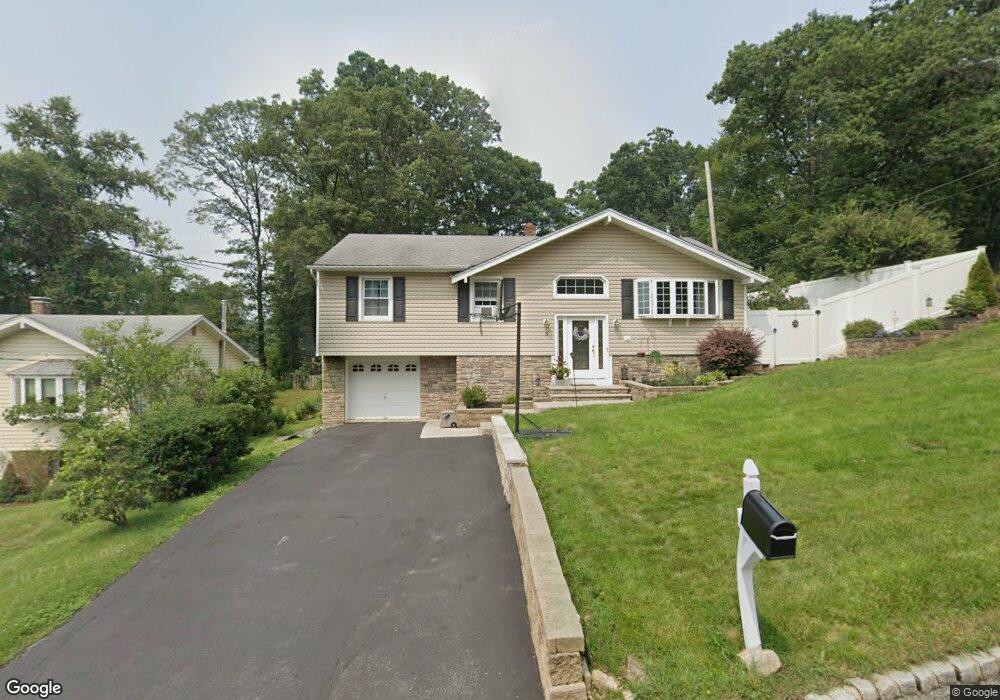
23 Unger Ave Stanhope, NJ 07874
Estimated Value: $473,350 - $532,000
--
Bed
--
Bath
2,066
Sq Ft
$246/Sq Ft
Est. Value
About This Home
This home is located at 23 Unger Ave, Stanhope, NJ 07874 and is currently estimated at $507,838, approximately $245 per square foot. 23 Unger Ave is a home located in Sussex County with nearby schools including Durban Avenue Elementary School, Hudson Maxim Elementary School, and Tulsa Trail Elementary School.
Ownership History
Date
Name
Owned For
Owner Type
Purchase Details
Closed on
Nov 15, 1993
Sold by
Dohery Robert L
Bought by
Deuar Defredo and Deuar Giouce
Current Estimated Value
Home Financials for this Owner
Home Financials are based on the most recent Mortgage that was taken out on this home.
Original Mortgage
$123,000
Interest Rate
6.77%
Create a Home Valuation Report for This Property
The Home Valuation Report is an in-depth analysis detailing your home's value as well as a comparison with similar homes in the area
Home Values in the Area
Average Home Value in this Area
Purchase History
| Date | Buyer | Sale Price | Title Company |
|---|---|---|---|
| Deuar Defredo | $129,500 | -- |
Source: Public Records
Mortgage History
| Date | Status | Borrower | Loan Amount |
|---|---|---|---|
| Closed | Deuar Defredo | $123,000 |
Source: Public Records
Tax History Compared to Growth
Tax History
| Year | Tax Paid | Tax Assessment Tax Assessment Total Assessment is a certain percentage of the fair market value that is determined by local assessors to be the total taxable value of land and additions on the property. | Land | Improvement |
|---|---|---|---|---|
| 2025 | $8,146 | $390,700 | $112,300 | $278,400 |
| 2024 | $8,755 | $390,700 | $112,300 | $278,400 |
| 2023 | $8,755 | $250,200 | $71,500 | $178,700 |
| 2022 | $8,582 | $250,200 | $71,500 | $178,700 |
| 2021 | $8,437 | $250,200 | $71,500 | $178,700 |
| 2020 | $8,349 | $250,200 | $71,500 | $178,700 |
| 2019 | $8,314 | $250,200 | $71,500 | $178,700 |
| 2018 | $8,297 | $250,200 | $71,500 | $178,700 |
| 2017 | $8,284 | $250,200 | $71,500 | $178,700 |
| 2016 | $8,302 | $250,200 | $71,500 | $178,700 |
| 2015 | $8,114 | $250,200 | $71,500 | $178,700 |
| 2014 | $8,086 | $250,200 | $71,500 | $178,700 |
Source: Public Records
Map
Nearby Homes