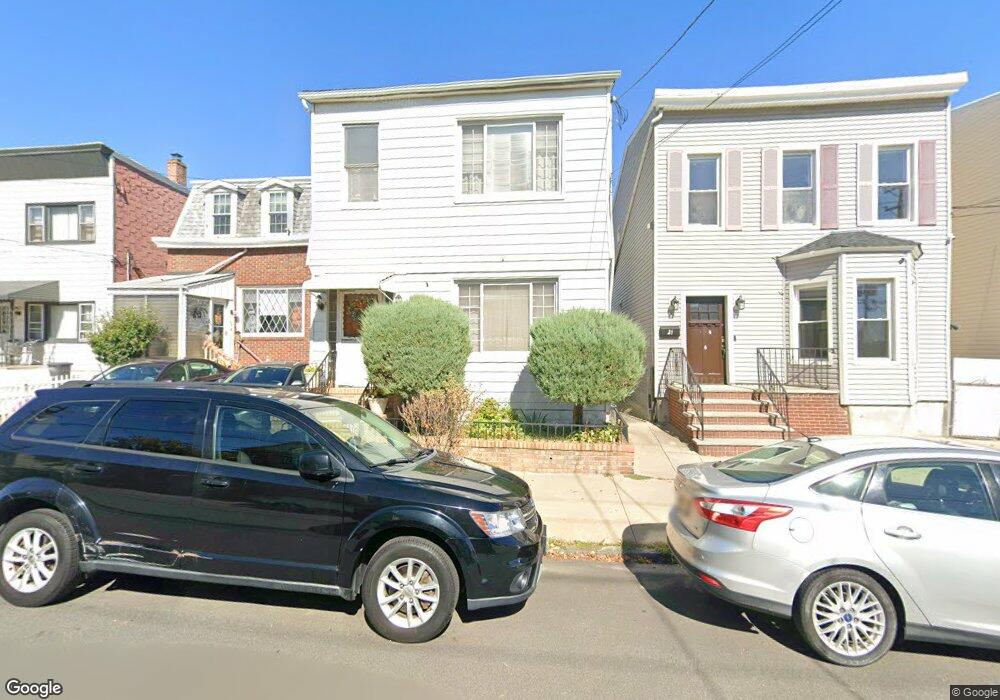
23 W 54th St Bayonne, NJ 07002
North Bayonne NeighborhoodEstimated Value: $572,945 - $802,000
--
Bed
--
Bath
1,764
Sq Ft
$366/Sq Ft
Est. Value
About This Home
This home is located at 23 W 54th St, Bayonne, NJ 07002 and is currently estimated at $646,486, approximately $366 per square foot. 23 W 54th St is a home located in Hudson County with nearby schools including Bayonne High School and T.E.T. Christian Academy.
Ownership History
Date
Name
Owned For
Owner Type
Purchase Details
Closed on
Aug 8, 2022
Sold by
Lopez Jose R and Lopez Angelita
Bought by
Lopez Maribel and Herrera Yanire
Current Estimated Value
Home Financials for this Owner
Home Financials are based on the most recent Mortgage that was taken out on this home.
Original Mortgage
$250,000
Outstanding Balance
$238,608
Interest Rate
5.3%
Mortgage Type
New Conventional
Estimated Equity
$407,878
Purchase Details
Closed on
Aug 8, 2000
Sold by
Jeffrey Adam Inc
Bought by
Lopez Jose R and Lopez Angelita
Home Financials for this Owner
Home Financials are based on the most recent Mortgage that was taken out on this home.
Original Mortgage
$160,000
Interest Rate
8.21%
Purchase Details
Closed on
Jun 21, 1999
Sold by
Hsbc Bank Usa
Bought by
Jeffrey Adam Inc
Purchase Details
Closed on
Aug 10, 1998
Sold by
Hromy Brian and Hromy Maryann
Bought by
Marine Midland Bank
Create a Home Valuation Report for This Property
The Home Valuation Report is an in-depth analysis detailing your home's value as well as a comparison with similar homes in the area
Home Values in the Area
Average Home Value in this Area
Purchase History
| Date | Buyer | Sale Price | Title Company |
|---|---|---|---|
| Lopez Maribel | $469,000 | Wfg National Title | |
| Lopez Jose R | $175,000 | -- | |
| Jeffrey Adam Inc | $82,500 | -- | |
| Marine Midland Bank | -- | -- |
Source: Public Records
Mortgage History
| Date | Status | Borrower | Loan Amount |
|---|---|---|---|
| Open | Lopez Maribel | $250,000 | |
| Previous Owner | Lopez Jose R | $160,000 |
Source: Public Records
Tax History Compared to Growth
Tax History
| Year | Tax Paid | Tax Assessment Tax Assessment Total Assessment is a certain percentage of the fair market value that is determined by local assessors to be the total taxable value of land and additions on the property. | Land | Improvement |
|---|---|---|---|---|
| 2025 | $11,441 | $409,200 | $171,000 | $238,200 |
| 2024 | $10,979 | $409,200 | $171,000 | $238,200 |
| 2023 | $10,979 | $409,200 | $171,000 | $238,200 |
| 2022 | $10,774 | $409,200 | $171,000 | $238,200 |
| 2021 | $10,688 | $409,200 | $171,000 | $238,200 |
| 2020 | $10,500 | $409,200 | $171,000 | $238,200 |
| 2019 | $11,115 | $128,800 | $62,500 | $66,300 |
| 2018 | $10,894 | $128,800 | $62,500 | $66,300 |
| 2017 | $10,612 | $128,800 | $62,500 | $66,300 |
| 2016 | $10,220 | $128,800 | $62,500 | $66,300 |
| 2015 | $9,884 | $128,800 | $62,500 | $66,300 |
| 2014 | $9,589 | $128,800 | $62,500 | $66,300 |
Source: Public Records
Map
Nearby Homes
- 71 W 54th St
- 81 W 55th St
- 89 W 55th St
- 1043 Broadway
- 99 W 50th St
- 18 Ocean Ave
- 18 W 49th St
- 20 W 49th St
- 20 W 49th St Unit 1 & 2
- 245 Avenue B
- 127 W 51st St
- 51 W 48th St
- 53 W 48th St Unit 105
- 233 Avenue B
- 1011 Avenue C Unit B326
- 67 W 48th St Unit 234
- 24 E 49th St
- 26 E 49th St
- 1264 Kennedy Blvd
- 1225 Kennedy Blvd Unit 1K
- 23 W 54th St Unit 2
- 21 W 54th St
- 25 W 54th St
- 27 W 54th St
- 19 W 54th St
- 29 W 54th St
- 31 W 54th St
- 33 W 54th St
- 32 W 55th St
- 32 W 55th St Unit R
- 32 W 55th St Unit 2
- 35 W 54th St
- 34 W 55th St Unit 36
- 34 W 55th St Unit B
- 34 W 55th St Unit A
- 34 W 55th St Unit 2R
- 34 W 55th St Unit 1F
- 24 W 54th St
- 26 W 54th St
- 22 W 54th St