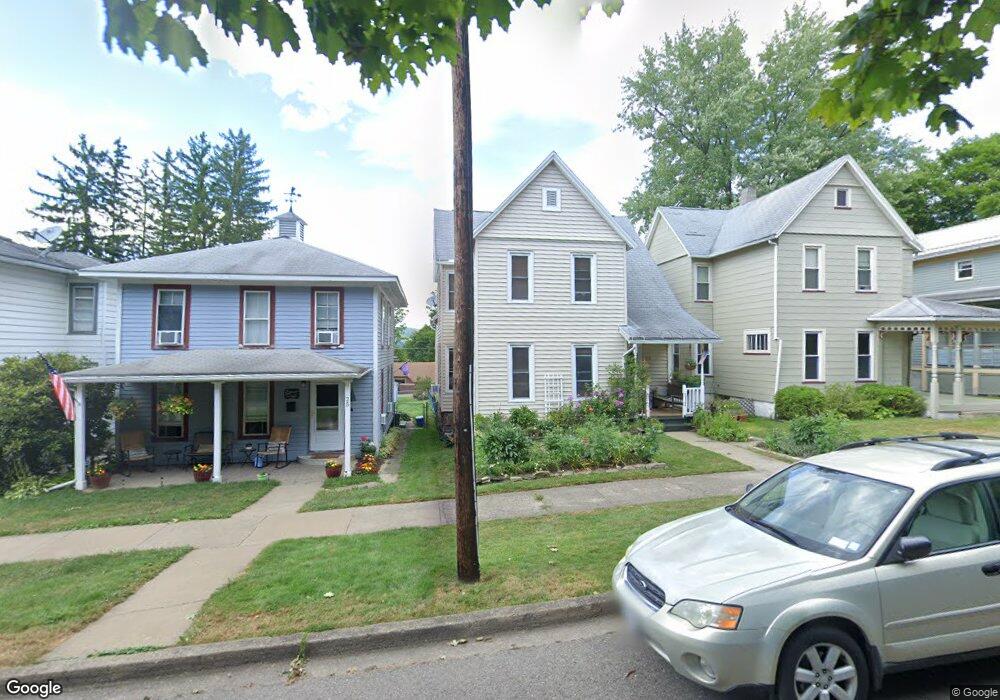
23 W 5th St Corning, NY 14830
Estimated Value: $164,000 - $192,000
4
Beds
2
Baths
1,817
Sq Ft
$96/Sq Ft
Est. Value
About This Home
This home is located at 23 W 5th St, Corning, NY 14830 and is currently estimated at $175,288, approximately $96 per square foot. 23 W 5th St is a home located in Steuben County with nearby schools including Frederick Carder Elementary School, Corning-Painted Post Middle School, and Corning-Painted Post High School.
Ownership History
Date
Name
Owned For
Owner Type
Purchase Details
Closed on
Feb 6, 2017
Sold by
Mulligan Molly M
Bought by
Orr Emmett
Current Estimated Value
Home Financials for this Owner
Home Financials are based on the most recent Mortgage that was taken out on this home.
Original Mortgage
$79,000
Outstanding Balance
$38,811
Interest Rate
3.44%
Mortgage Type
Purchase Money Mortgage
Estimated Equity
$136,477
Purchase Details
Closed on
Aug 31, 2009
Sold by
Daines Timothy Michael,Melissa
Bought by
Mulligan Molly M
Create a Home Valuation Report for This Property
The Home Valuation Report is an in-depth analysis detailing your home's value as well as a comparison with similar homes in the area
Home Values in the Area
Average Home Value in this Area
Purchase History
| Date | Buyer | Sale Price | Title Company |
|---|---|---|---|
| Orr Emmett | -- | Steven W Barnstead | |
| Mulligan Molly M | $54,000 | Jhn R Bloise |
Source: Public Records
Mortgage History
| Date | Status | Borrower | Loan Amount |
|---|---|---|---|
| Open | Orr Emmett | $79,000 |
Source: Public Records
Tax History Compared to Growth
Tax History
| Year | Tax Paid | Tax Assessment Tax Assessment Total Assessment is a certain percentage of the fair market value that is determined by local assessors to be the total taxable value of land and additions on the property. | Land | Improvement |
|---|---|---|---|---|
| 2024 | $5,691 | $149,000 | $14,400 | $134,600 |
| 2023 | $4,137 | $149,000 | $14,400 | $134,600 |
| 2022 | $4,455 | $110,000 | $6,200 | $103,800 |
| 2021 | $4,455 | $110,000 | $6,200 | $103,800 |
| 2020 | $2,024 | $110,000 | $6,200 | $103,800 |
| 2019 | $4,181 | $110,000 | $6,200 | $103,800 |
| 2018 | $4,181 | $110,000 | $6,200 | $103,800 |
| 2017 | $2,911 | $110,000 | $6,200 | $103,800 |
| 2016 | $2,883 | $110,000 | $6,200 | $103,800 |
| 2015 | -- | $110,000 | $6,200 | $103,800 |
| 2014 | -- | $110,000 | $6,200 | $103,800 |
Source: Public Records
Map
Nearby Homes