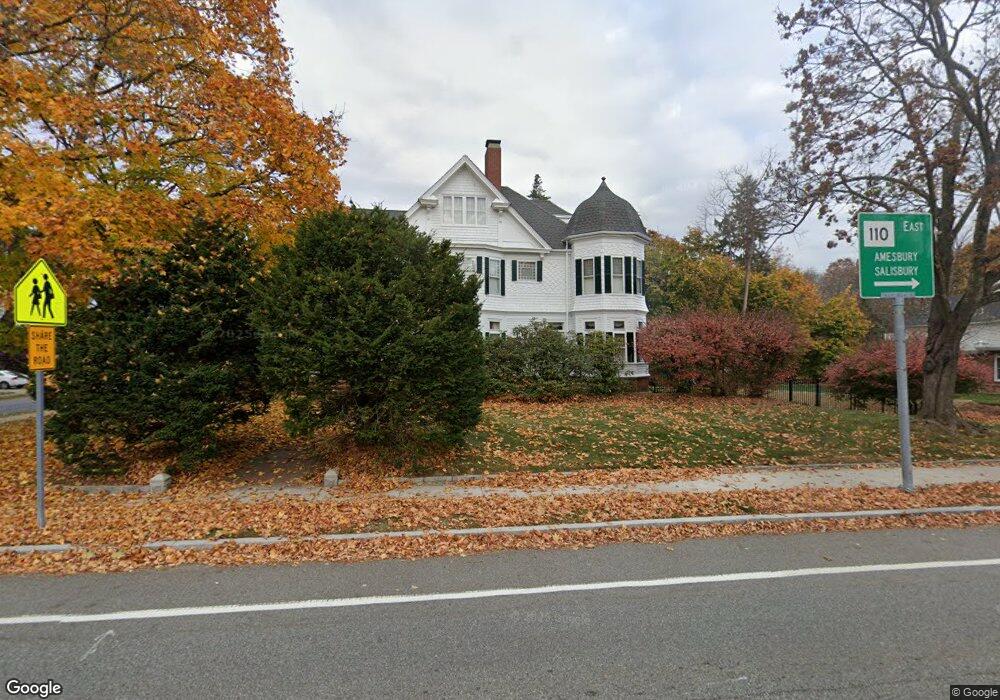
23 W Main St Merrimac, MA 01860
Estimated Value: $912,000 - $1,091,000
2
Beds
1
Bath
920
Sq Ft
$1,091/Sq Ft
Est. Value
About This Home
This home is located at 23 W Main St, Merrimac, MA 01860 and is currently estimated at $1,003,859, approximately $1,091 per square foot. 23 W Main St is a home located in Essex County with nearby schools including Pentucket Regional High School.
Ownership History
Date
Name
Owned For
Owner Type
Purchase Details
Closed on
Jul 10, 1997
Sold by
Roche Esther E
Bought by
Cavanaugh Timothy J
Current Estimated Value
Home Financials for this Owner
Home Financials are based on the most recent Mortgage that was taken out on this home.
Original Mortgage
$334,000
Outstanding Balance
$49,396
Interest Rate
7.86%
Mortgage Type
Purchase Money Mortgage
Estimated Equity
$954,463
Purchase Details
Closed on
Dec 28, 1993
Sold by
Jamerson Paul D and Jamerson Michele
Bought by
Texas Commerce N B
Purchase Details
Closed on
Nov 2, 1992
Sold by
Holwell Edith E
Bought by
Jamerson Paul D and Jamerson Michele
Home Financials for this Owner
Home Financials are based on the most recent Mortgage that was taken out on this home.
Original Mortgage
$175,500
Interest Rate
7.85%
Mortgage Type
Purchase Money Mortgage
Purchase Details
Closed on
Oct 6, 1987
Sold by
Bk Of New England
Bought by
Holwell Edith E
Create a Home Valuation Report for This Property
The Home Valuation Report is an in-depth analysis detailing your home's value as well as a comparison with similar homes in the area
Home Values in the Area
Average Home Value in this Area
Purchase History
| Date | Buyer | Sale Price | Title Company |
|---|---|---|---|
| Cavanaugh Timothy J | $352,000 | -- | |
| Texas Commerce N B | $217,000 | -- | |
| Jamerson Paul D | $195,000 | -- | |
| Holwell Edith E | $185,000 | -- |
Source: Public Records
Mortgage History
| Date | Status | Borrower | Loan Amount |
|---|---|---|---|
| Open | Holwell Edith E | $35,000 | |
| Open | Cavanaugh Timothy J | $334,000 | |
| Previous Owner | Holwell Edith E | $175,500 |
Source: Public Records
Tax History Compared to Growth
Tax History
| Year | Tax Paid | Tax Assessment Tax Assessment Total Assessment is a certain percentage of the fair market value that is determined by local assessors to be the total taxable value of land and additions on the property. | Land | Improvement |
|---|---|---|---|---|
| 2025 | $11,524 | $869,700 | $327,100 | $542,600 |
| 2024 | $11,271 | $834,900 | $308,900 | $526,000 |
| 2023 | $10,643 | $720,600 | $261,600 | $459,000 |
| 2022 | $10,561 | $646,300 | $210,800 | $435,500 |
| 2021 | $9,910 | $608,000 | $192,600 | $415,400 |
| 2020 | $9,047 | $608,000 | $192,600 | $415,400 |
| 2019 | $8,839 | $559,100 | $167,200 | $391,900 |
| 2018 | $8,747 | $555,000 | $156,300 | $398,700 |
| 2017 | $8,652 | $529,500 | $130,800 | $398,700 |
| 2016 | $8,154 | $504,600 | $130,800 | $373,800 |
| 2015 | $7,818 | $481,100 | $130,800 | $350,300 |
| 2014 | $7,537 | $474,300 | $130,800 | $343,500 |
Source: Public Records
Map
Nearby Homes
- 25 W Main St
- 27 W Main St
- 21 W Main St
- 0 Woodland St
- 30 W Main St
- 6 Woodland St
- 4 Woodland St
- 2 Locust St
- 29 W Main St
- 19 W Main St Unit 15
- 19 W Main St Unit 14
- 19 W Main St Unit 13
- 19 W Main St Unit 12
- 19 W Main St Unit 11
- 19 W Main St Unit 10
- 19 W Main St Unit 9
- 19 W Main St Unit 7
- 19 W Main St Unit 6
- 19 W Main St Unit 5
- 19 W Main St Unit 4