23 Waverly Dr Fort Mitchell, AL 36856
Estimated Value: $432,000 - $504,000
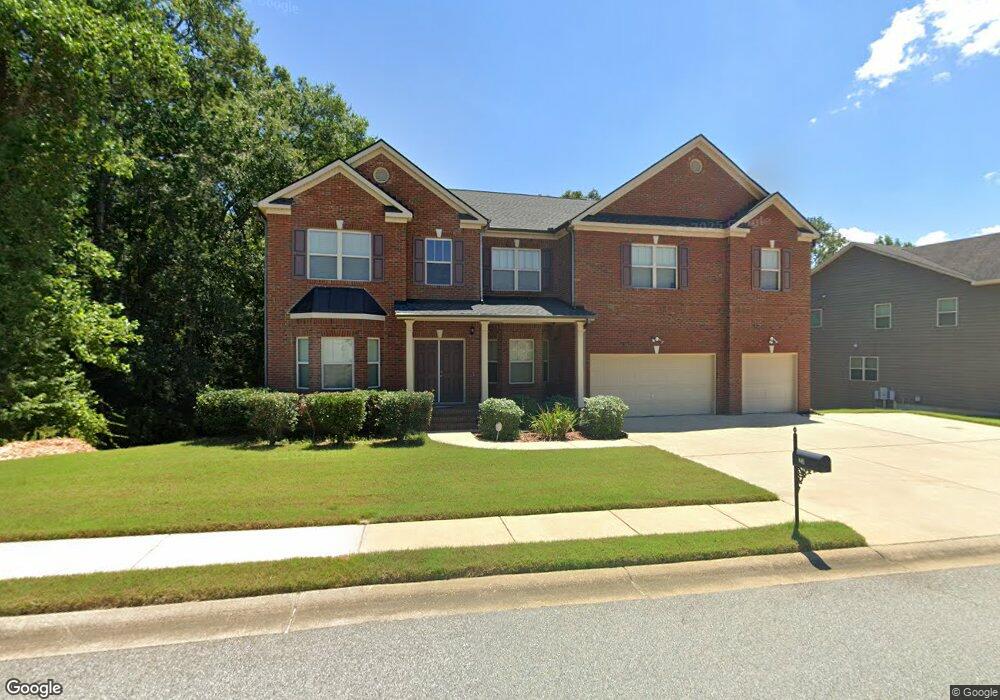
About This Home
This home is located at 23 Waverly Dr, Fort Mitchell, AL 36856 and is currently estimated at $462,727, approximately $78 per square foot. 23 Waverly Dr is a home with nearby schools including Russell County Middle School and Russell County High School.
Ownership History
We collect this data history from publicly available records. To have your information removed, we recommend requesting removal directly through your county’s website.
Purchase Details
Home Financials for this Owner
Home Financials are based on the most recent Mortgage that was taken out on this home.Purchase History
We collect this data history from publicly available records. To have your information removed, we recommend requesting removal directly through your county’s website.
| Date | Buyer | Sale Price | Title Company |
|---|---|---|---|
| $328,232 | -- |
Mortgage History
We collect this data history from publicly available records. To have your information removed, we recommend requesting removal directly through your county’s website.
| Date | Status | Borrower | Loan Amount |
|---|---|---|---|
| Closed | $342,591 | ||
| Closed | $227,850 | ||
| Closed | $339,244 | ||
| Closed | $328,232 |
Tax History
We collect this data history from publicly available records. To have your information removed, we recommend requesting removal directly through your county’s website.
| Year | Tax Paid | Tax Assessment Tax Assessment Total Assessment is a certain percentage of the fair market value that is determined by local assessors to be the total taxable value of land and additions on the property. | Land | Improvement |
|---|---|---|---|---|
| 2025 | $50 | $47,090 | $1,950 | $45,140 |
| 2024 | $50 | $47,160 | $1,950 | $45,210 |
| 2023 | $50 | $44,209 | $1,950 | $42,259 |
| 2022 | $50 | $40,001 | $1,950 | $38,051 |
| 2021 | $50 | $40,106 | $1,950 | $38,156 |
| 2020 | $50 | $36,400 | $1,960 | $34,440 |
| 2019 | $1,277 | $35,460 | $1,960 | $33,500 |
| 2018 | $1,244 | $34,560 | $1,960 | $32,600 |
| 2017 | $1,245 | $33,600 | $1,960 | $31,640 |
| 2016 | $1,234 | $34,280 | $1,960 | $32,320 |
| 2015 | $1,119 | $32,467 | $2,600 | $29,867 |
| 2014 | $1,118 | $32,447 | $2,600 | $29,847 |
Map
- 0 Hwy 165 Unit E103279
- 22 Cedar Sage Ln
- 16 Cedar Sage Ln
- 8 Cypress Glen Ct
- 14 Cypress Glen Ct
- 37 Gunner Dr
- 15 Mount Olive Dr
- 15 Northgate Dr
- NA Peacock Dr
- 26 Peacock Dr
- 28 Peacock Dr
- 34 Peacock Dr
- 40 Peacock Dr
- 17 Isaac Dr
- 11 Jason Dr
- 21 Avery Place
- 37 Pioneer Dr
- 38 Avery Place
- 0 Blueberry Rd
- 21 Sweetwater Park Loop
Ask me questions while you tour the home.