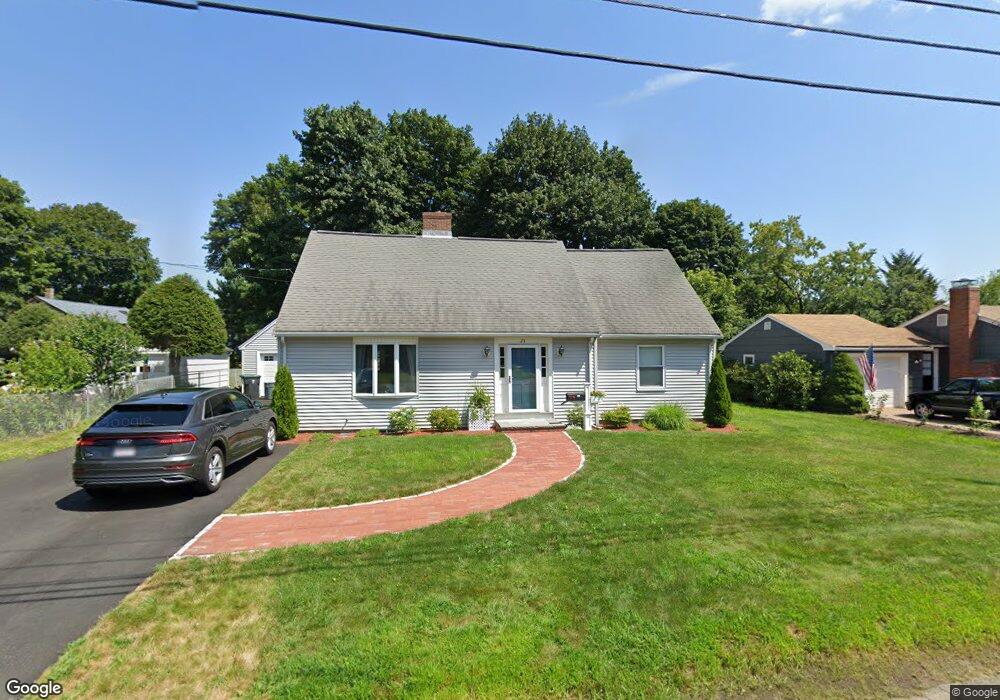
23 Wellesley Rd Natick, MA 01760
Estimated Value: $819,994 - $1,003,000
5
Beds
3
Baths
2,077
Sq Ft
$438/Sq Ft
Est. Value
About This Home
This home is located at 23 Wellesley Rd, Natick, MA 01760 and is currently estimated at $908,999, approximately $437 per square foot. 23 Wellesley Rd is a home located in Middlesex County with nearby schools including Natick High School, Wilson Middle School, and Bennett-Hemenway (Ben-Hem) Elementary School.
Ownership History
Date
Name
Owned For
Owner Type
Purchase Details
Closed on
Jul 29, 1999
Sold by
Shea Sandra J
Bought by
Shea Kevin M and Shea Heidi M
Current Estimated Value
Home Financials for this Owner
Home Financials are based on the most recent Mortgage that was taken out on this home.
Original Mortgage
$130,000
Interest Rate
7.61%
Mortgage Type
Purchase Money Mortgage
Create a Home Valuation Report for This Property
The Home Valuation Report is an in-depth analysis detailing your home's value as well as a comparison with similar homes in the area
Home Values in the Area
Average Home Value in this Area
Purchase History
| Date | Buyer | Sale Price | Title Company |
|---|---|---|---|
| Shea Kevin M | $130,000 | -- |
Source: Public Records
Mortgage History
| Date | Status | Borrower | Loan Amount |
|---|---|---|---|
| Open | Shea Kevin M | $30,000 | |
| Open | Shea Kevin M | $208,000 | |
| Closed | Shea Kevin M | $190,000 | |
| Closed | Shea Kevin M | $130,000 |
Source: Public Records
Tax History Compared to Growth
Tax History
| Year | Tax Paid | Tax Assessment Tax Assessment Total Assessment is a certain percentage of the fair market value that is determined by local assessors to be the total taxable value of land and additions on the property. | Land | Improvement |
|---|---|---|---|---|
| 2025 | $7,717 | $645,200 | $403,800 | $241,400 |
| 2024 | $7,509 | $612,500 | $380,000 | $232,500 |
| 2023 | $7,535 | $596,100 | $365,800 | $230,300 |
| 2022 | $7,354 | $551,300 | $332,500 | $218,800 |
| 2021 | $7,066 | $519,200 | $313,500 | $205,700 |
| 2020 | $6,873 | $505,000 | $299,300 | $205,700 |
| 2019 | $6,795 | $448,200 | $299,300 | $148,900 |
| 2018 | $5,574 | $427,100 | $285,000 | $142,100 |
| 2017 | $5,298 | $392,700 | $242,300 | $150,400 |
| 2016 | $4,975 | $366,600 | $217,600 | $149,000 |
| 2015 | $4,901 | $354,600 | $217,600 | $137,000 |
Source: Public Records
Map
Nearby Homes