Estimated Value: $269,000 - $383,000
4
Beds
2
Baths
2,047
Sq Ft
$156/Sq Ft
Est. Value
About This Home
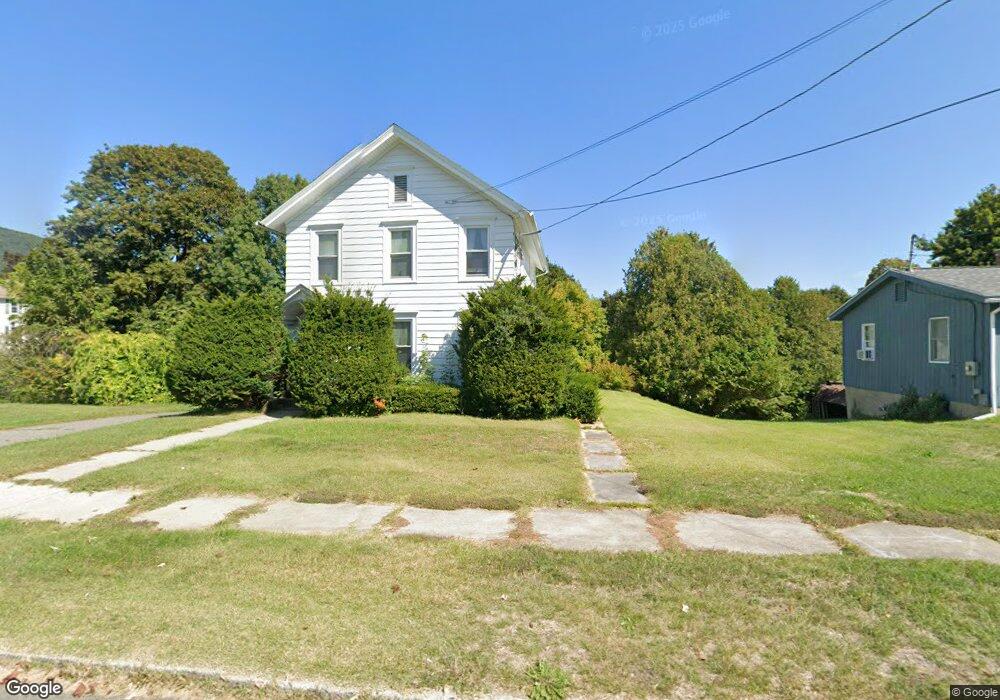
This home is located at 23 West St, Adams, MA 01220 and is currently estimated at $318,975, approximately $155 per square foot. 23 West St is a home located in Berkshire County with nearby schools including Hoosac Valley Middle & High School, Berkshire Arts & Technology Charter Public School, and St. Stanislaus Kostka School.
Ownership History
Date
Name
Owned For
Owner Type
Purchase Details
Closed on
Oct 31, 1989
Sold by
Cholewinsi Dennis F
Bought by
Main John G
Current Estimated Value
Home Financials for this Owner
Home Financials are based on the most recent Mortgage that was taken out on this home.
Original Mortgage
$75,000
Interest Rate
9.94%
Mortgage Type
Purchase Money Mortgage
Create a Home Valuation Report for This Property
The Home Valuation Report is an in-depth analysis detailing your home's value as well as a comparison with similar homes in the area
Home Values in the Area
Average Home Value in this Area
Purchase History
| Date | Buyer | Sale Price | Title Company |
|---|---|---|---|
| Main John G | $95,000 | -- |
Source: Public Records
Mortgage History
| Date | Status | Borrower | Loan Amount |
|---|---|---|---|
| Closed | Main John G | $75,000 | |
| Previous Owner | Main John G | $64,000 |
Source: Public Records
Tax History Compared to Growth
Tax History
| Year | Tax Paid | Tax Assessment Tax Assessment Total Assessment is a certain percentage of the fair market value that is determined by local assessors to be the total taxable value of land and additions on the property. | Land | Improvement |
|---|---|---|---|---|
| 2025 | $3,766 | $221,400 | $54,300 | $167,100 |
| 2024 | $3,557 | $202,800 | $51,100 | $151,700 |
| 2023 | $3,313 | $178,600 | $46,400 | $132,200 |
| 2022 | $3,242 | $155,200 | $40,400 | $114,800 |
| 2021 | $3,183 | $140,700 | $40,400 | $100,300 |
| 2020 | $3,022 | $138,100 | $40,600 | $97,500 |
| 2019 | $2,954 | $138,100 | $40,600 | $97,500 |
| 2018 | $3,029 | $136,400 | $40,600 | $95,800 |
| 2017 | $2,915 | $136,400 | $40,600 | $95,800 |
| 2016 | $2,821 | $131,900 | $40,600 | $91,300 |
| 2015 | $2,763 | $129,300 | $42,500 | $86,800 |
| 2014 | $2,580 | $129,300 | $42,500 | $86,800 |
Source: Public Records
Map
Nearby Homes