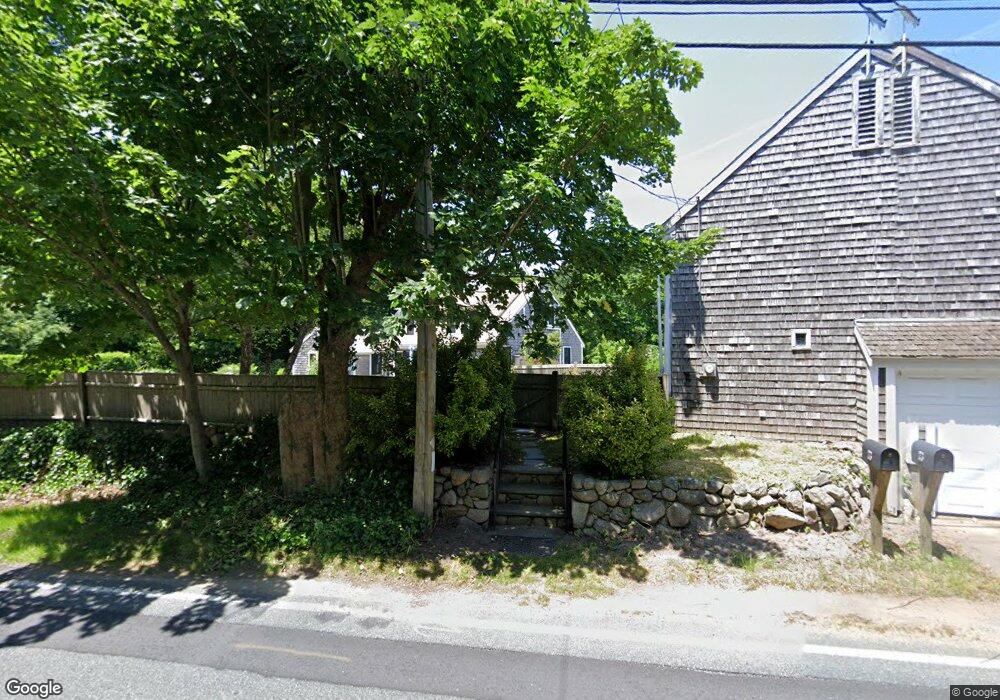
23 Willow St West Yarmouth, MA 02673
Yarmouth Port NeighborhoodEstimated Value: $778,000 - $997,000
3
Beds
3
Baths
1,589
Sq Ft
$563/Sq Ft
Est. Value
About This Home
This home is located at 23 Willow St, West Yarmouth, MA 02673 and is currently estimated at $895,269, approximately $563 per square foot. 23 Willow St is a home located in Barnstable County with nearby schools including Dennis-Yarmouth Regional High School, Sturgis Charter Public School, and Trinity Christian Academy of Cape Cod.
Ownership History
Date
Name
Owned For
Owner Type
Purchase Details
Closed on
Feb 2, 2023
Sold by
Hill John M and Hill Ann M
Bought by
John and John Ann Hill
Current Estimated Value
Purchase Details
Closed on
Aug 31, 2017
Sold by
Lancaster David
Bought by
Hill John M and Maxwell-Hill Ann
Purchase Details
Closed on
Apr 29, 2010
Sold by
Hayman Bradley R and Hayman Ross C
Bought by
Lancaster David
Home Financials for this Owner
Home Financials are based on the most recent Mortgage that was taken out on this home.
Original Mortgage
$283,500
Interest Rate
4.99%
Mortgage Type
Purchase Money Mortgage
Purchase Details
Closed on
Oct 8, 2009
Sold by
Easling Kim M and Hayman Bradley R
Bought by
Hayman Ross C
Purchase Details
Closed on
Dec 5, 2008
Sold by
Hayman Ross C
Bought by
Hayman Bradley R and Easling Kim M
Create a Home Valuation Report for This Property
The Home Valuation Report is an in-depth analysis detailing your home's value as well as a comparison with similar homes in the area
Home Values in the Area
Average Home Value in this Area
Purchase History
| Date | Buyer | Sale Price | Title Company |
|---|---|---|---|
| John | -- | None Available | |
| Hill John M | $544,000 | -- | |
| Lancaster David | $315,000 | -- | |
| Hayman Ross C | -- | -- | |
| Hayman Bradley R | -- | -- |
Source: Public Records
Mortgage History
| Date | Status | Borrower | Loan Amount |
|---|---|---|---|
| Previous Owner | Lancaster David | $283,500 |
Source: Public Records
Tax History Compared to Growth
Tax History
| Year | Tax Paid | Tax Assessment Tax Assessment Total Assessment is a certain percentage of the fair market value that is determined by local assessors to be the total taxable value of land and additions on the property. | Land | Improvement |
|---|---|---|---|---|
| 2025 | $4,618 | $652,300 | $241,900 | $410,400 |
| 2024 | $4,291 | $581,400 | $210,400 | $371,000 |
| 2023 | $4,449 | $548,600 | $177,600 | $371,000 |
| 2022 | $4,275 | $465,700 | $158,900 | $306,800 |
| 2021 | $3,957 | $413,900 | $158,900 | $255,000 |
| 2020 | $4,425 | $442,500 | $156,400 | $286,100 |
| 2019 | $4,469 | $442,500 | $156,400 | $286,100 |
| 2018 | $134 | $401,900 | $147,200 | $254,700 |
| 2017 | $3,688 | $368,100 | $147,200 | $220,900 |
| 2016 | $3,674 | $368,100 | $147,200 | $220,900 |
| 2015 | $3,875 | $386,000 | $147,200 | $238,800 |
Source: Public Records
Map
Nearby Homes
- 112 Main St
- 116 Main (Route 6a) St
- 116 Main St
- 4390 Main St
- 56 Wharf Ln
- 162 Route 6a
- 33 Midpine Rd
- 25 Congressional Dr
- 186 Route 6a
- 105 Old Hyannis Rd
- 81 Desert Sands Ln
- 65 Oakmont Rd
- 99 Old Hyannis Rd
- 111 Old Hyannis Rd
- 371 Route 6a
- 44 Iris Ln
- 30 Indian Trail
- 21 Indian Trail
- 17 Indian Trail
- 92 Brentwood Dr