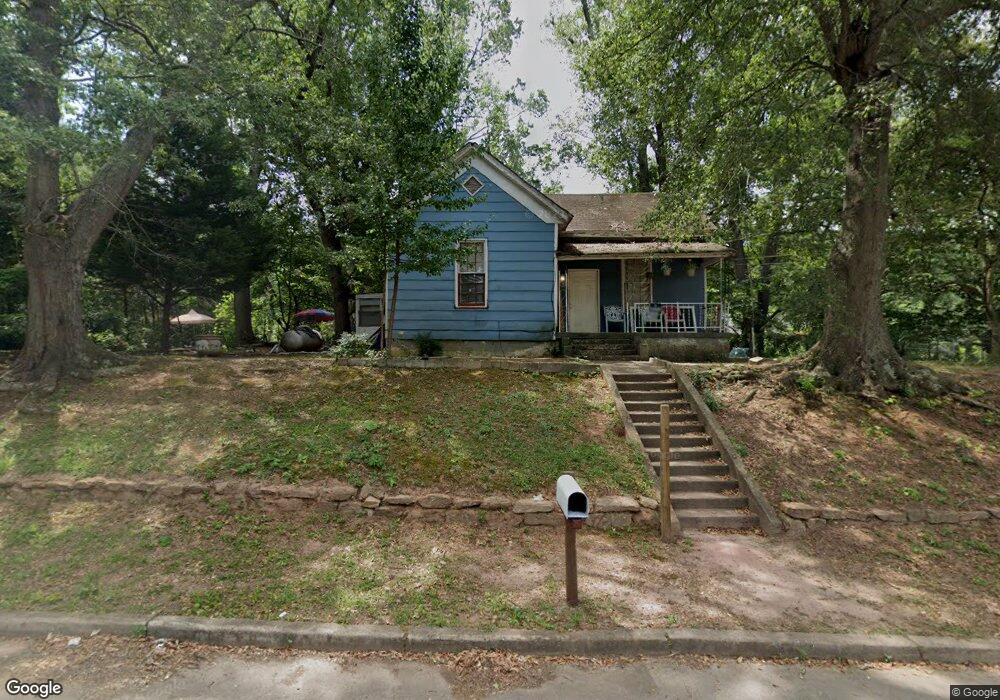
23 Wilson St Manchester, GA 31816
Estimated Value: $61,084 - $121,000
3
Beds
1
Bath
1,290
Sq Ft
$65/Sq Ft
Est. Value
About This Home
This home is located at 23 Wilson St, Manchester, GA 31816 and is currently estimated at $84,021, approximately $65 per square foot. 23 Wilson St is a home located in Meriwether County with nearby schools including Mountain View Elementary School, Manchester Middle School, and Manchester High School.
Ownership History
Date
Name
Owned For
Owner Type
Purchase Details
Closed on
Sep 3, 2013
Sold by
Meriwether County Tax Comm
Bought by
Pearson James A and Pearson Frances C
Current Estimated Value
Purchase Details
Closed on
Nov 15, 2010
Sold by
American General Financial
Bought by
Stonecrest Income
Purchase Details
Closed on
Jul 6, 2005
Sold by
Lilley Matthew
Bought by
Lilley Irene and Lilley Marvin L
Purchase Details
Closed on
Mar 26, 1999
Sold by
Houston Larry M
Bought by
Lilley Mathew
Purchase Details
Closed on
Aug 29, 1997
Sold by
Lilley Marvin Lee
Bought by
Houston Larry M
Purchase Details
Closed on
May 17, 1996
Sold by
First Family Financi
Bought by
Lilley Marvin Lee
Purchase Details
Closed on
Nov 1, 1995
Sold by
Wriston Dean A and Wriston Et
Bought by
First Family Financi
Purchase Details
Closed on
May 1, 1993
Sold by
Richard L Montgomery
Bought by
Wriston Dean A and Wriston Et
Create a Home Valuation Report for This Property
The Home Valuation Report is an in-depth analysis detailing your home's value as well as a comparison with similar homes in the area
Home Values in the Area
Average Home Value in this Area
Purchase History
| Date | Buyer | Sale Price | Title Company |
|---|---|---|---|
| Pearson James A | -- | -- | |
| Stonecrest Income | $10,000 | -- | |
| Stonecrest Income | $10,000 | -- | |
| Lilley Irene | -- | -- | |
| Lilley Mathew | -- | -- | |
| Houston Larry M | -- | -- | |
| Lilley Marvin Lee | $12,000 | -- | |
| First Family Financi | $10,500 | -- | |
| Wriston Dean A | $18,000 | -- |
Source: Public Records
Tax History Compared to Growth
Tax History
| Year | Tax Paid | Tax Assessment Tax Assessment Total Assessment is a certain percentage of the fair market value that is determined by local assessors to be the total taxable value of land and additions on the property. | Land | Improvement |
|---|---|---|---|---|
| 2024 | $433 | $9,172 | $2,440 | $6,732 |
| 2023 | $444 | $9,172 | $2,440 | $6,732 |
| 2022 | $444 | $9,172 | $2,440 | $6,732 |
| 2021 | $292 | $9,172 | $2,440 | $6,732 |
| 2020 | $295 | $9,172 | $2,440 | $6,732 |
| 2019 | $296 | $9,172 | $2,440 | $6,732 |
| 2018 | $299 | $10,812 | $2,440 | $8,372 |
| 2017 | $357 | $10,812 | $2,440 | $8,372 |
| 2016 | $356 | $10,812 | $2,440 | $8,372 |
| 2015 | $356 | $10,812 | $2,440 | $8,372 |
| 2014 | $357 | $10,812 | $2,440 | $8,372 |
| 2013 | -- | $10,812 | $2,440 | $8,372 |
Source: Public Records
Map
Nearby Homes
- 900 Mountain Ridge Dr Unit 4.89 ACRES
- 12 Truitt St
- 21 North St
- 16 North St
- 380 Elm St
- 94 Cato St
- 3.26 ACRES Mountain Ridge Dr
- 408 Broad St
- 77 Cordwood St
- 322 Chalybeate St
- 304 4th St
- 13.27 ACRES Roosevelt Hwy
- 522 4th St
- 802 Jd Parham Dr
- 919 L S Glencamp Way
- 1600 Grant Ave
- 617 Mayes Way
- 514 Farris Blvd
- 621 Mayes Way
- 286 Starling Rd