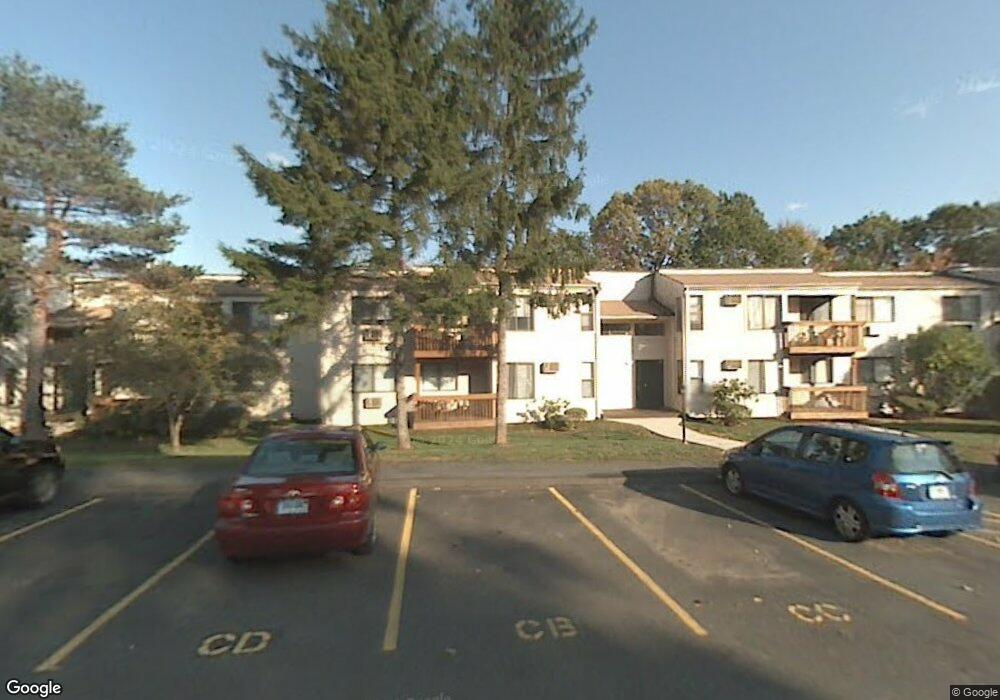
23 Woodland Dr Cromwell, CT 06416
Estimated Value: $195,000 - $216,000
2
Beds
2
Baths
968
Sq Ft
$213/Sq Ft
Est. Value
About This Home
This home is located at 23 Woodland Dr, Cromwell, CT 06416 and is currently estimated at $206,342, approximately $213 per square foot. 23 Woodland Dr is a home located in Middlesex County with nearby schools including Edna C. Stevens School, Woodside Intermediate School, and Cromwell Middle School.
Ownership History
Date
Name
Owned For
Owner Type
Purchase Details
Closed on
Apr 1, 2021
Sold by
Cristache Mirela E
Bought by
Starr Duplin J
Current Estimated Value
Home Financials for this Owner
Home Financials are based on the most recent Mortgage that was taken out on this home.
Original Mortgage
$121,250
Outstanding Balance
$109,474
Interest Rate
3%
Mortgage Type
Balloon
Estimated Equity
$96,868
Purchase Details
Closed on
Oct 9, 2007
Sold by
Sattar Brian H
Bought by
Cristache Mirela E
Purchase Details
Closed on
Jun 13, 2005
Sold by
Siedlecki Sylwester and Siedlecki Aneta
Bought by
Sattar Brian H and Cristache Mirela E
Home Financials for this Owner
Home Financials are based on the most recent Mortgage that was taken out on this home.
Original Mortgage
$122,700
Interest Rate
5.79%
Create a Home Valuation Report for This Property
The Home Valuation Report is an in-depth analysis detailing your home's value as well as a comparison with similar homes in the area
Home Values in the Area
Average Home Value in this Area
Purchase History
| Date | Buyer | Sale Price | Title Company |
|---|---|---|---|
| Starr Duplin J | -- | None Available | |
| Cristache Mirela E | $59,272 | -- | |
| Sattar Brian H | $126,500 | -- |
Source: Public Records
Mortgage History
| Date | Status | Borrower | Loan Amount |
|---|---|---|---|
| Open | Starr Duplin J | $121,250 | |
| Previous Owner | Sattar Brian H | $112,113 | |
| Previous Owner | Sattar Brian H | $122,700 |
Source: Public Records
Tax History Compared to Growth
Tax History
| Year | Tax Paid | Tax Assessment Tax Assessment Total Assessment is a certain percentage of the fair market value that is determined by local assessors to be the total taxable value of land and additions on the property. | Land | Improvement |
|---|---|---|---|---|
| 2025 | $2,836 | $92,120 | $0 | $92,120 |
| 2024 | $2,770 | $92,120 | $0 | $92,120 |
| 2023 | $2,709 | $92,120 | $0 | $92,120 |
| 2022 | $2,009 | $60,270 | $0 | $60,270 |
| 2021 | $2,009 | $60,270 | $0 | $60,270 |
| 2020 | $1,979 | $60,270 | $0 | $60,270 |
| 2019 | $1,979 | $60,270 | $0 | $60,270 |
| 2018 | $1,979 | $60,270 | $0 | $60,270 |
| 2017 | $2,225 | $65,570 | $0 | $65,570 |
| 2016 | $2,205 | $65,570 | $0 | $65,570 |
| 2015 | $2,058 | $65,570 | $0 | $65,570 |
| 2014 | $2,182 | $65,570 | $0 | $65,570 |
Source: Public Records
Map
Nearby Homes
- 92 Woodland Dr Unit 92
- 96 Woodland Dr Unit 96
- 188 Woodland Dr
- 165 Woodland Dr Unit 165
- 58 Blackhaw Dr
- 148 Evergreen Rd
- 8 Mohawk Ct
- 30 Larkspur Dr
- 12 Sydney Ln
- 9 Bayberry Ct
- 7 Willow Ct Unit 7
- 5 Chestnut Ct Unit 5
- 6 Juniper Hill Ct Unit 6
- 2 Gatesville Ln Unit 6
- 22 Linda Ct Unit 22
- 27 Chestnut Ct Unit 27
- 23 Margo Ct Unit 23
- 2 Birch Ct Unit 2
- 124 Coles Rd
- 120 Washington Rd
- 23 Woodland Dr Unit 23
- 25 Woodland Dr
- 25 Woodland Dr Unit 25
- 24 Woodland Dr
- 24 Woodland Dr Unit 24
- 21 Woodland Dr
- 21 Woodland Dr Unit DRIVE
- 21 Woodland Dr Unit 21
- 22 Woodland Dr
- 22 Woodland Dr Unit 22
- 26 Woodland Dr
- 27 Woodland Dr
- 27 Woodland Dr Unit 27
- 19 Woodland Dr
- 20 Woodland Dr
- 20 Woodland Dr Unit 220
- 20 Woodland Dr Unit 20
- 29 Woodland Dr
- 30 Woodland Dr
- 30 Woodland Dr Unit 30