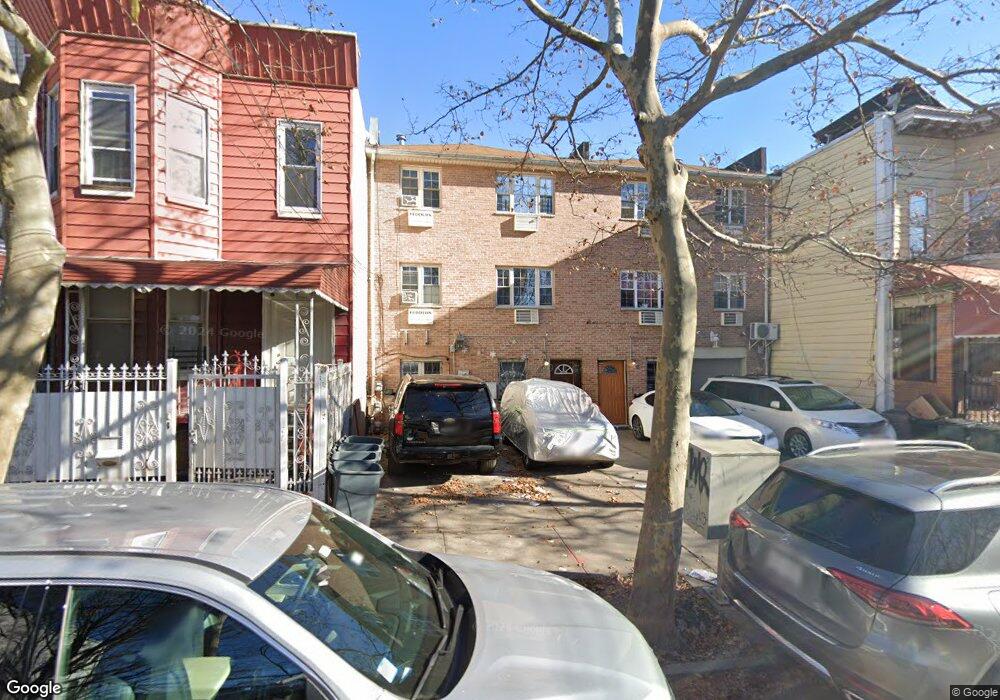
23 Wyona St Brooklyn, NY 11207
Cypress Hills NeighborhoodEstimated Value: $769,593 - $1,049,000
--
Bed
--
Bath
2,970
Sq Ft
$305/Sq Ft
Est. Value
About This Home
This home is located at 23 Wyona St, Brooklyn, NY 11207 and is currently estimated at $906,648, approximately $305 per square foot. 23 Wyona St is a home located in Kings County with nearby schools including P.S. 290 - Juan Morel Campos, Liberty Avenue Middle School, and Vista Academy.
Ownership History
Date
Name
Owned For
Owner Type
Purchase Details
Closed on
Mar 24, 2021
Sold by
Vizcaino Claudia
Bought by
Diaz Francisco
Current Estimated Value
Purchase Details
Closed on
Nov 15, 2006
Sold by
Home Vision Inc
Bought by
Vizcaino Claudia
Home Financials for this Owner
Home Financials are based on the most recent Mortgage that was taken out on this home.
Original Mortgage
$177,500
Interest Rate
6.36%
Purchase Details
Closed on
Jan 27, 1999
Sold by
Johnny Holding Corp
Bought by
Home Vision Inc
Purchase Details
Closed on
Oct 17, 1997
Sold by
Kandhai Rajesh
Bought by
Johnny Holding Corp
Create a Home Valuation Report for This Property
The Home Valuation Report is an in-depth analysis detailing your home's value as well as a comparison with similar homes in the area
Home Values in the Area
Average Home Value in this Area
Purchase History
| Date | Buyer | Sale Price | Title Company |
|---|---|---|---|
| Diaz Francisco | $700,000 | -- | |
| Diaz Francisco | $700,000 | -- | |
| Vizcaino Claudia | $710,000 | -- | |
| Vizcaino Claudia | $710,000 | -- | |
| Home Vision Inc | $29,000 | First American Title Ins Co | |
| Home Vision Inc | $29,000 | First American Title Ins Co | |
| Johnny Holding Corp | $9,000 | -- | |
| Johnny Holding Corp | $9,000 | -- |
Source: Public Records
Mortgage History
| Date | Status | Borrower | Loan Amount |
|---|---|---|---|
| Previous Owner | Vizcaino Claudia | $177,500 | |
| Previous Owner | Vizcaino Claudia | $532,500 |
Source: Public Records
Tax History Compared to Growth
Tax History
| Year | Tax Paid | Tax Assessment Tax Assessment Total Assessment is a certain percentage of the fair market value that is determined by local assessors to be the total taxable value of land and additions on the property. | Land | Improvement |
|---|---|---|---|---|
| 2025 | $8,443 | $55,980 | $20,940 | $35,040 |
| 2024 | $8,443 | $47,580 | $20,940 | $26,640 |
| 2023 | $8,054 | $58,380 | $20,940 | $37,440 |
| 2022 | $7,917 | $50,760 | $20,940 | $29,820 |
| 2021 | $7,987 | $40,740 | $20,940 | $19,800 |
| 2020 | $3,737 | $45,840 | $20,940 | $24,900 |
| 2019 | $7,035 | $45,840 | $20,940 | $24,900 |
| 2018 | $6,439 | $33,048 | $14,031 | $19,017 |
| 2017 | $6,437 | $33,048 | $18,395 | $14,653 |
| 2016 | $6,247 | $32,799 | $18,522 | $14,277 |
| 2015 | $3,713 | $30,943 | $18,414 | $12,529 |
| 2014 | $3,713 | $29,192 | $20,859 | $8,333 |
Source: Public Records
Map
Nearby Homes
- 52 Bradford St
- 57 Wyona St
- 2735 Fulton St
- 107 Miller Ave
- 48 van Siclen Ave
- 52 van Siclen Ave
- 90 Wyona St
- 168 Miller Ave
- 14 van Siclen Ct
- 178 Highland Blvd
- 153 Hendrix St
- 153 Highland Blvd
- 224 Highland Blvd Unit 710
- 4 Crosby Ave
- 2830 Fulton St
- 87 Schenck Ave
- 133 Sunnyside Ave
- 174 van Siclen Ave
- 3 Schenck Ct
- 159 Wyona St