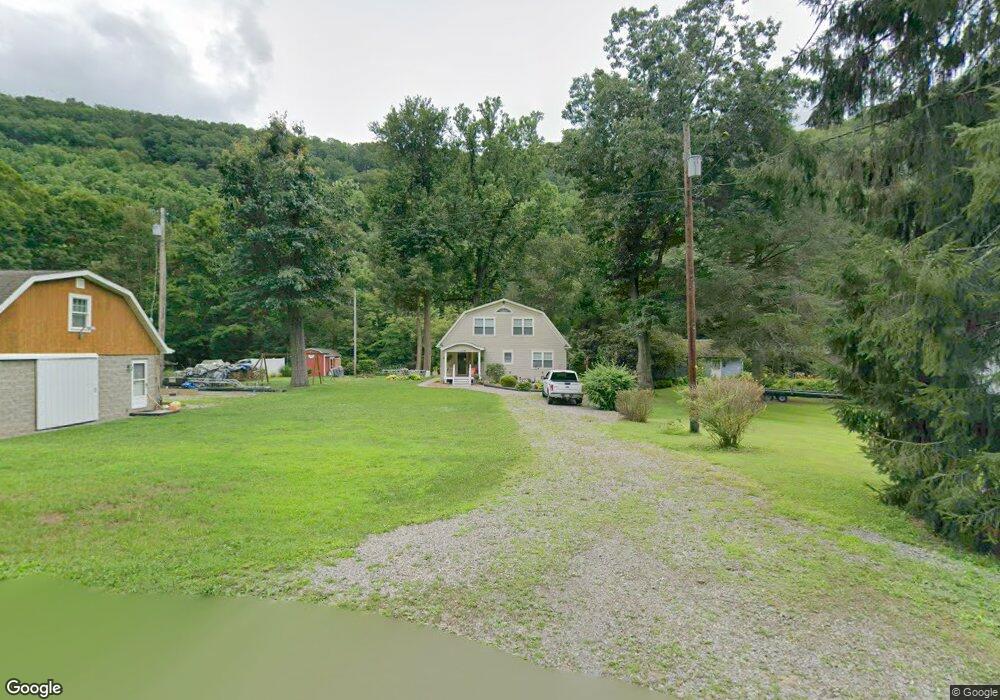
230 1/2 Olean Rd Templeton, PA 16259
Estimated Value: $189,000 - $399,000
3
Beds
2
Baths
2,268
Sq Ft
$122/Sq Ft
Est. Value
About This Home
This home is located at 230 1/2 Olean Rd, Templeton, PA 16259 and is currently estimated at $276,061, approximately $121 per square foot. 230 1/2 Olean Rd is a home with nearby schools including Redbank Valley Primary School, Redbank Valley Intermediate School, and Redbank Valley High School.
Ownership History
Date
Name
Owned For
Owner Type
Purchase Details
Closed on
Apr 28, 2014
Sold by
Beattie Randall J
Bought by
Flynn Pamela L
Current Estimated Value
Purchase Details
Closed on
Mar 13, 1998
Bought by
Beattie Larry E
Purchase Details
Closed on
Sep 12, 1983
Create a Home Valuation Report for This Property
The Home Valuation Report is an in-depth analysis detailing your home's value as well as a comparison with similar homes in the area
Home Values in the Area
Average Home Value in this Area
Purchase History
| Date | Buyer | Sale Price | Title Company |
|---|---|---|---|
| Flynn Pamela L | -- | None Available | |
| Beattie Larry E | -- | -- | |
| -- | -- | -- |
Source: Public Records
Tax History Compared to Growth
Tax History
| Year | Tax Paid | Tax Assessment Tax Assessment Total Assessment is a certain percentage of the fair market value that is determined by local assessors to be the total taxable value of land and additions on the property. | Land | Improvement |
|---|---|---|---|---|
| 2025 | $3,581 | $57,650 | $29,410 | $28,240 |
| 2024 | $3,058 | $57,650 | $29,410 | $28,240 |
| 2023 | $2,113 | $57,650 | $29,410 | $28,240 |
| 2022 | $2,113 | $57,650 | $29,410 | $28,240 |
| 2021 | $1,996 | $57,650 | $29,410 | $28,240 |
| 2020 | $1,888 | $57,650 | $29,410 | $28,240 |
| 2019 | $1,855 | $57,650 | $29,410 | $28,240 |
| 2018 | $1,821 | $42,020 | $1,675 | $40,345 |
| 2017 | $1,773 | $57,650 | $29,410 | $28,240 |
| 2016 | $555 | $17,430 | $9,300 | $8,130 |
| 2015 | $498 | $17,430 | $9,300 | $8,130 |
| 2014 | $498 | $17,430 | $9,300 | $8,130 |
Source: Public Records
Map
Nearby Homes
- 712 Stewartson Rd
- 714 Stewartson Rd
- 231 Stone Ave
- 612 State Route 1031
- 1405 Madison Rd
- 0 Silver Rock Rd
- 218 State Route 1034
- 583 Adrian Reesedale Rd
- Spot Rd
- 464 State Route 1027
- 455 Adrian Sherrett Rd
- 1182 State Route 1035
- 119 Kohlersburg Rd
- 107 Center St
- 230 Smithland Rd
- 1060 Wattersonville Rd
- 1594 Johnston Ave
- 548 State Route 1035
- 1028 State Route 268
- 1504 N Grant Ave