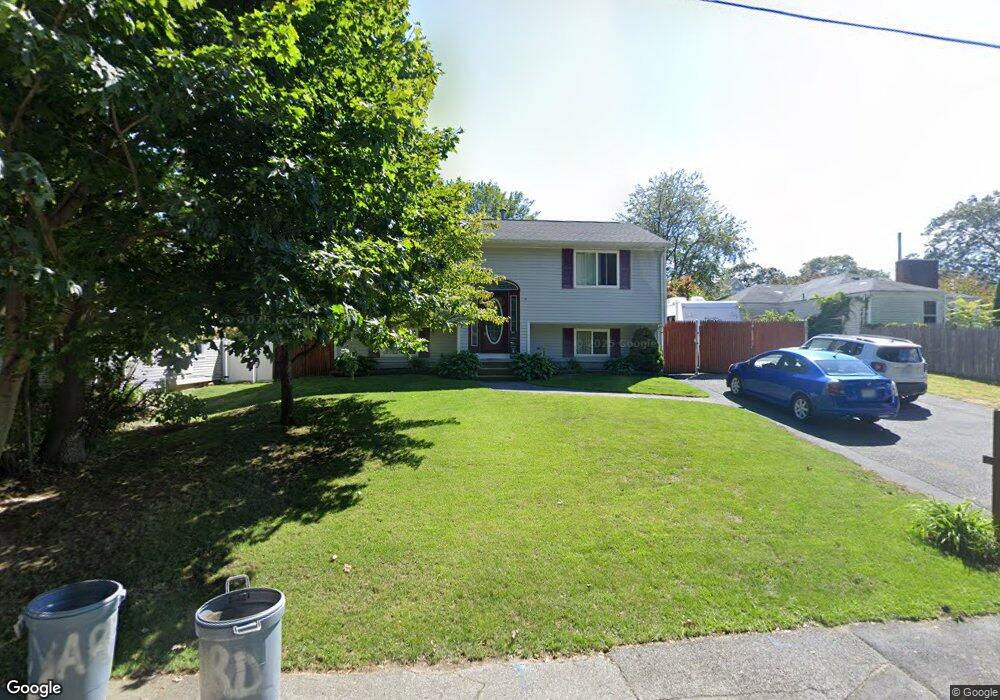
230 2nd Ave Warwick, RI 02888
Norwood NeighborhoodEstimated Value: $381,636 - $415,000
2
Beds
1
Bath
1,264
Sq Ft
$313/Sq Ft
Est. Value
About This Home
This home is located at 230 2nd Ave, Warwick, RI 02888 and is currently estimated at $395,409, approximately $312 per square foot. 230 2nd Ave is a home located in Kent County.
Ownership History
Date
Name
Owned For
Owner Type
Purchase Details
Closed on
May 31, 2000
Sold by
Calci Geraldine A
Bought by
Burr Kevin J and Baker Dawn Marie
Current Estimated Value
Purchase Details
Closed on
Mar 2, 1992
Sold by
Deblois Bldg Co
Bought by
Roy Geraldine A
Create a Home Valuation Report for This Property
The Home Valuation Report is an in-depth analysis detailing your home's value as well as a comparison with similar homes in the area
Home Values in the Area
Average Home Value in this Area
Purchase History
| Date | Buyer | Sale Price | Title Company |
|---|---|---|---|
| Burr Kevin J | $107,500 | -- | |
| Roy Geraldine A | $99,000 | -- | |
| Roy Geraldine A | $99,000 | -- |
Source: Public Records
Mortgage History
| Date | Status | Borrower | Loan Amount |
|---|---|---|---|
| Open | Roy Geraldine A | $118,825 | |
| Closed | Roy Geraldine A | $42,675 | |
| Closed | Roy Geraldine A | $141,550 |
Source: Public Records
Tax History
| Year | Tax Paid | Tax Assessment Tax Assessment Total Assessment is a certain percentage of the fair market value that is determined by local assessors to be the total taxable value of land and additions on the property. | Land | Improvement |
|---|---|---|---|---|
| 2025 | $4,496 | $354,000 | $101,700 | $252,300 |
| 2024 | $4,393 | $303,600 | $88,400 | $215,200 |
| 2023 | $4,308 | $303,600 | $88,400 | $215,200 |
| 2022 | $4,128 | $220,400 | $57,500 | $162,900 |
| 2021 | $4,128 | $220,400 | $57,500 | $162,900 |
| 2020 | $4,128 | $220,400 | $57,500 | $162,900 |
| 2019 | $4,128 | $220,400 | $57,500 | $162,900 |
| 2018 | $3,625 | $174,300 | $57,500 | $116,800 |
| 2017 | $3,528 | $174,300 | $57,500 | $116,800 |
| 2016 | $3,528 | $174,300 | $57,500 | $116,800 |
| 2015 | $3,380 | $162,900 | $56,500 | $106,400 |
| 2014 | $3,268 | $162,900 | $56,500 | $106,400 |
| 2013 | $3,224 | $162,900 | $56,500 | $106,400 |
Source: Public Records
Map
Nearby Homes
Your Personal Tour Guide
Ask me questions while you tour the home.