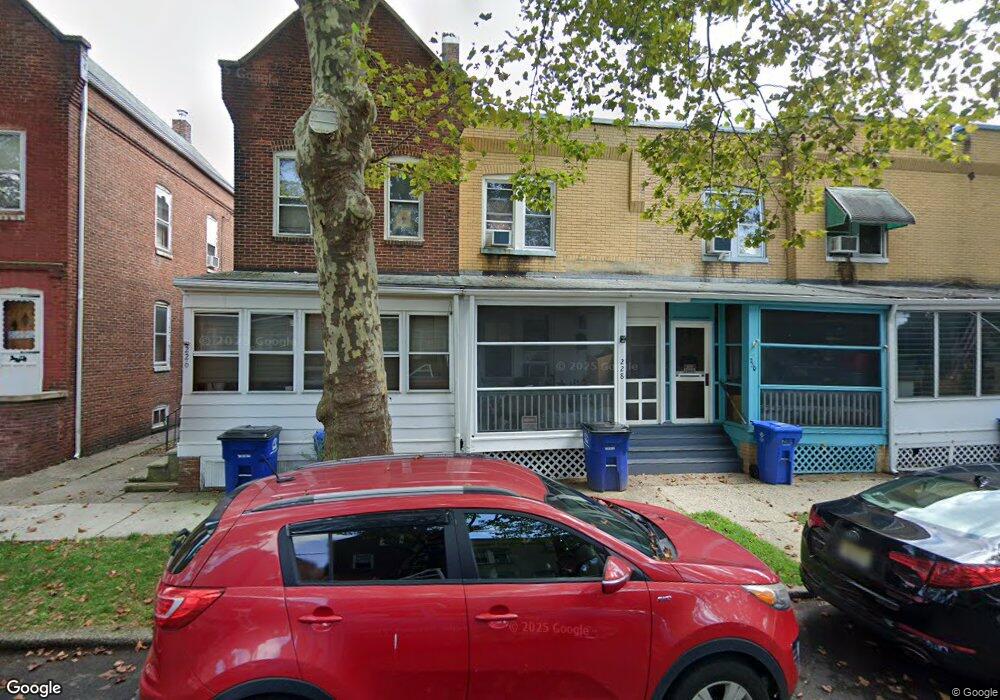
230 5th Ave Roebling, NJ 08554
Estimated Value: $228,000 - $257,000
--
Bed
--
Bath
1,156
Sq Ft
$209/Sq Ft
Est. Value
About This Home
This home is located at 230 5th Ave, Roebling, NJ 08554 and is currently estimated at $241,451, approximately $208 per square foot. 230 5th Ave is a home located in Burlington County with nearby schools including Number 5, Roebling Elementary School, Riverfront Middle School, and Florence Twp Mem High School.
Ownership History
Date
Name
Owned For
Owner Type
Purchase Details
Closed on
Jun 15, 2007
Sold by
Fennimore Clarence G and Fennimore Barbara C
Bought by
Askey Charlie Carter and Askey Cathy J
Current Estimated Value
Home Financials for this Owner
Home Financials are based on the most recent Mortgage that was taken out on this home.
Original Mortgage
$138,600
Outstanding Balance
$85,038
Interest Rate
6.24%
Mortgage Type
Purchase Money Mortgage
Estimated Equity
$156,413
Purchase Details
Closed on
Aug 20, 1998
Sold by
Fennimore Clarence G and Fennimore Barbara C
Bought by
Fennimore Barbara C
Create a Home Valuation Report for This Property
The Home Valuation Report is an in-depth analysis detailing your home's value as well as a comparison with similar homes in the area
Home Values in the Area
Average Home Value in this Area
Purchase History
| Date | Buyer | Sale Price | Title Company |
|---|---|---|---|
| Askey Charlie Carter | $154,000 | First American Title Ins Co | |
| Fennimore Barbara C | -- | -- |
Source: Public Records
Mortgage History
| Date | Status | Borrower | Loan Amount |
|---|---|---|---|
| Open | Askey Charlie Carter | $138,600 |
Source: Public Records
Tax History Compared to Growth
Tax History
| Year | Tax Paid | Tax Assessment Tax Assessment Total Assessment is a certain percentage of the fair market value that is determined by local assessors to be the total taxable value of land and additions on the property. | Land | Improvement |
|---|---|---|---|---|
| 2025 | $3,336 | $119,700 | $45,100 | $74,600 |
| 2024 | $3,194 | $119,700 | $45,100 | $74,600 |
| 2023 | $3,194 | $119,700 | $45,100 | $74,600 |
| 2022 | $3,125 | $119,700 | $45,100 | $74,600 |
| 2021 | $3,098 | $119,700 | $45,100 | $74,600 |
| 2020 | $3,086 | $119,700 | $45,100 | $74,600 |
| 2019 | $3,058 | $119,700 | $45,100 | $74,600 |
| 2018 | $3,032 | $119,700 | $45,100 | $74,600 |
| 2017 | $2,995 | $119,700 | $45,100 | $74,600 |
| 2016 | $2,937 | $119,700 | $45,100 | $74,600 |
| 2015 | $2,878 | $119,700 | $45,100 | $74,600 |
| 2014 | $3,333 | $142,600 | $45,100 | $97,500 |
Source: Public Records
Map
Nearby Homes