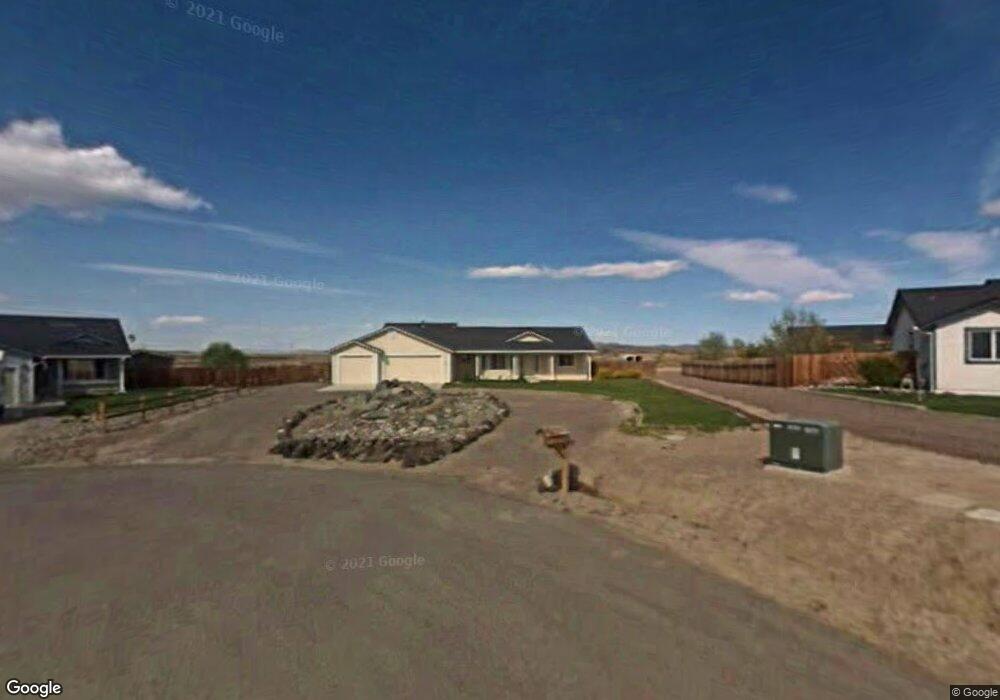
230 Bridle Path Way Fernley, NV 89408
Estimated Value: $467,000 - $523,000
3
Beds
2
Baths
1,646
Sq Ft
$304/Sq Ft
Est. Value
About This Home
This home is located at 230 Bridle Path Way, Fernley, NV 89408 and is currently estimated at $501,020, approximately $304 per square foot. 230 Bridle Path Way is a home located in Lyon County with nearby schools including East Valley Elementary School, Fernley Intermediate School, and Fernley High School.
Ownership History
Date
Name
Owned For
Owner Type
Purchase Details
Closed on
Sep 28, 2016
Sold by
Lightner Leona M
Bought by
Teepes Paul K
Current Estimated Value
Purchase Details
Closed on
May 11, 2012
Sold by
Henneman Dale E and Couch Courteney I
Bought by
Lightner Leona M
Home Financials for this Owner
Home Financials are based on the most recent Mortgage that was taken out on this home.
Original Mortgage
$140,409
Interest Rate
3.5%
Mortgage Type
FHA
Purchase Details
Closed on
Feb 26, 2007
Sold by
Heiss Kevin Lee
Bought by
Henneman Dale E and Couch Courteney I
Home Financials for this Owner
Home Financials are based on the most recent Mortgage that was taken out on this home.
Original Mortgage
$232,000
Interest Rate
6.21%
Mortgage Type
Purchase Money Mortgage
Create a Home Valuation Report for This Property
The Home Valuation Report is an in-depth analysis detailing your home's value as well as a comparison with similar homes in the area
Home Values in the Area
Average Home Value in this Area
Purchase History
| Date | Buyer | Sale Price | Title Company |
|---|---|---|---|
| Teepes Paul K | $280,000 | Western Title Co | |
| Lightner Leona M | $143,500 | Western Title Company | |
| Henneman Dale E | $290,000 | Stewart Title Of Northern Nv | |
| Heiss Kevin Lee | $290,000 | Stewart Title Of Northern Nv |
Source: Public Records
Mortgage History
| Date | Status | Borrower | Loan Amount |
|---|---|---|---|
| Previous Owner | Lightner Leona M | $140,409 | |
| Previous Owner | Henneman Dale E | $232,000 |
Source: Public Records
Tax History Compared to Growth
Tax History
| Year | Tax Paid | Tax Assessment Tax Assessment Total Assessment is a certain percentage of the fair market value that is determined by local assessors to be the total taxable value of land and additions on the property. | Land | Improvement |
|---|---|---|---|---|
| 2025 | $2,270 | $137,991 | $63,000 | $74,991 |
| 2024 | $2,613 | $138,575 | $63,000 | $75,574 |
| 2023 | $2,613 | $133,709 | $63,000 | $70,709 |
| 2022 | $2,450 | $127,833 | $63,000 | $64,833 |
| 2021 | $2,416 | $119,312 | $56,000 | $63,312 |
| 2020 | $2,353 | $117,091 | $56,000 | $61,091 |
| 2019 | $2,312 | $114,854 | $56,000 | $58,854 |
| 2018 | $2,260 | $99,524 | $42,000 | $57,524 |
| 2017 | $2,239 | $92,565 | $35,000 | $57,565 |
| 2016 | $2,037 | $52,718 | $11,550 | $41,168 |
| 2015 | $2,071 | $52,308 | $11,550 | $40,758 |
| 2014 | $2,015 | $52,458 | $11,550 | $40,908 |
Source: Public Records
Map
Nearby Homes
- 3175 Quick Cal Way
- 6778 Shell Ct
- 3457 Payton Way
- 3466 Payton Way
- 3462 Payton Way Unit Lot 98
- 3299 Hadley St Unit Lot 62
- 2976 N Fork Rd
- 3274 Eleanor Way
- 1357 Horse Creek Way
- 7785 Desert Shadows Ln
- 1428 Walker River Way
- 1477 Green River Ln
- 1434 Walker River Way
- 602 Tamsen Rd
- 132 Campfire Cir
- 112 Campfire Cir
- 1187 Jasmine Ln
- 1178 Jasmine Ln
- 1194 Jasmine Ln
- 1063 Pepper Ln Unit 192
- 230 Bridlepath Way
- 232 Bridle Path Way
- 228 Bridlepath Way
- 228 Bridle Path Way
- 232 Bridlepath Way
- 231 Bridlepath Way
- 226 Bridle Path Way
- 226 Bridlepath Way
- 227 Bridle Path Way
- 227 Bridlepath Way
- 229 Bridlepath Way
- 224 Bridle Path Way
- 224 Bridlepath Way
- 2890 Horseshoe Ln
- 222 Bridlepath Way
- 222 Bridle Path Way
- 188 Country Ranch Rd
- 2880 Horseshoe Ln
- 184 Country Ranch Rd
- 2885 Horseshoe Ln